Correction (July 21, 2026): The earlier article measured from the school year before state intervention and therefore overstated Providence's intervention-period loss and percentage decline. It also used that earlier baseline for statewide, comparison-district, and charter calculations. This version uses the 2019-20 package row, when intervention began, switches the statewide comparison to the authoritative state row, removes unsupported explanations, and rebuilds every chart and claim.
In this series: Rhode Island 2025-26 Enrollment.
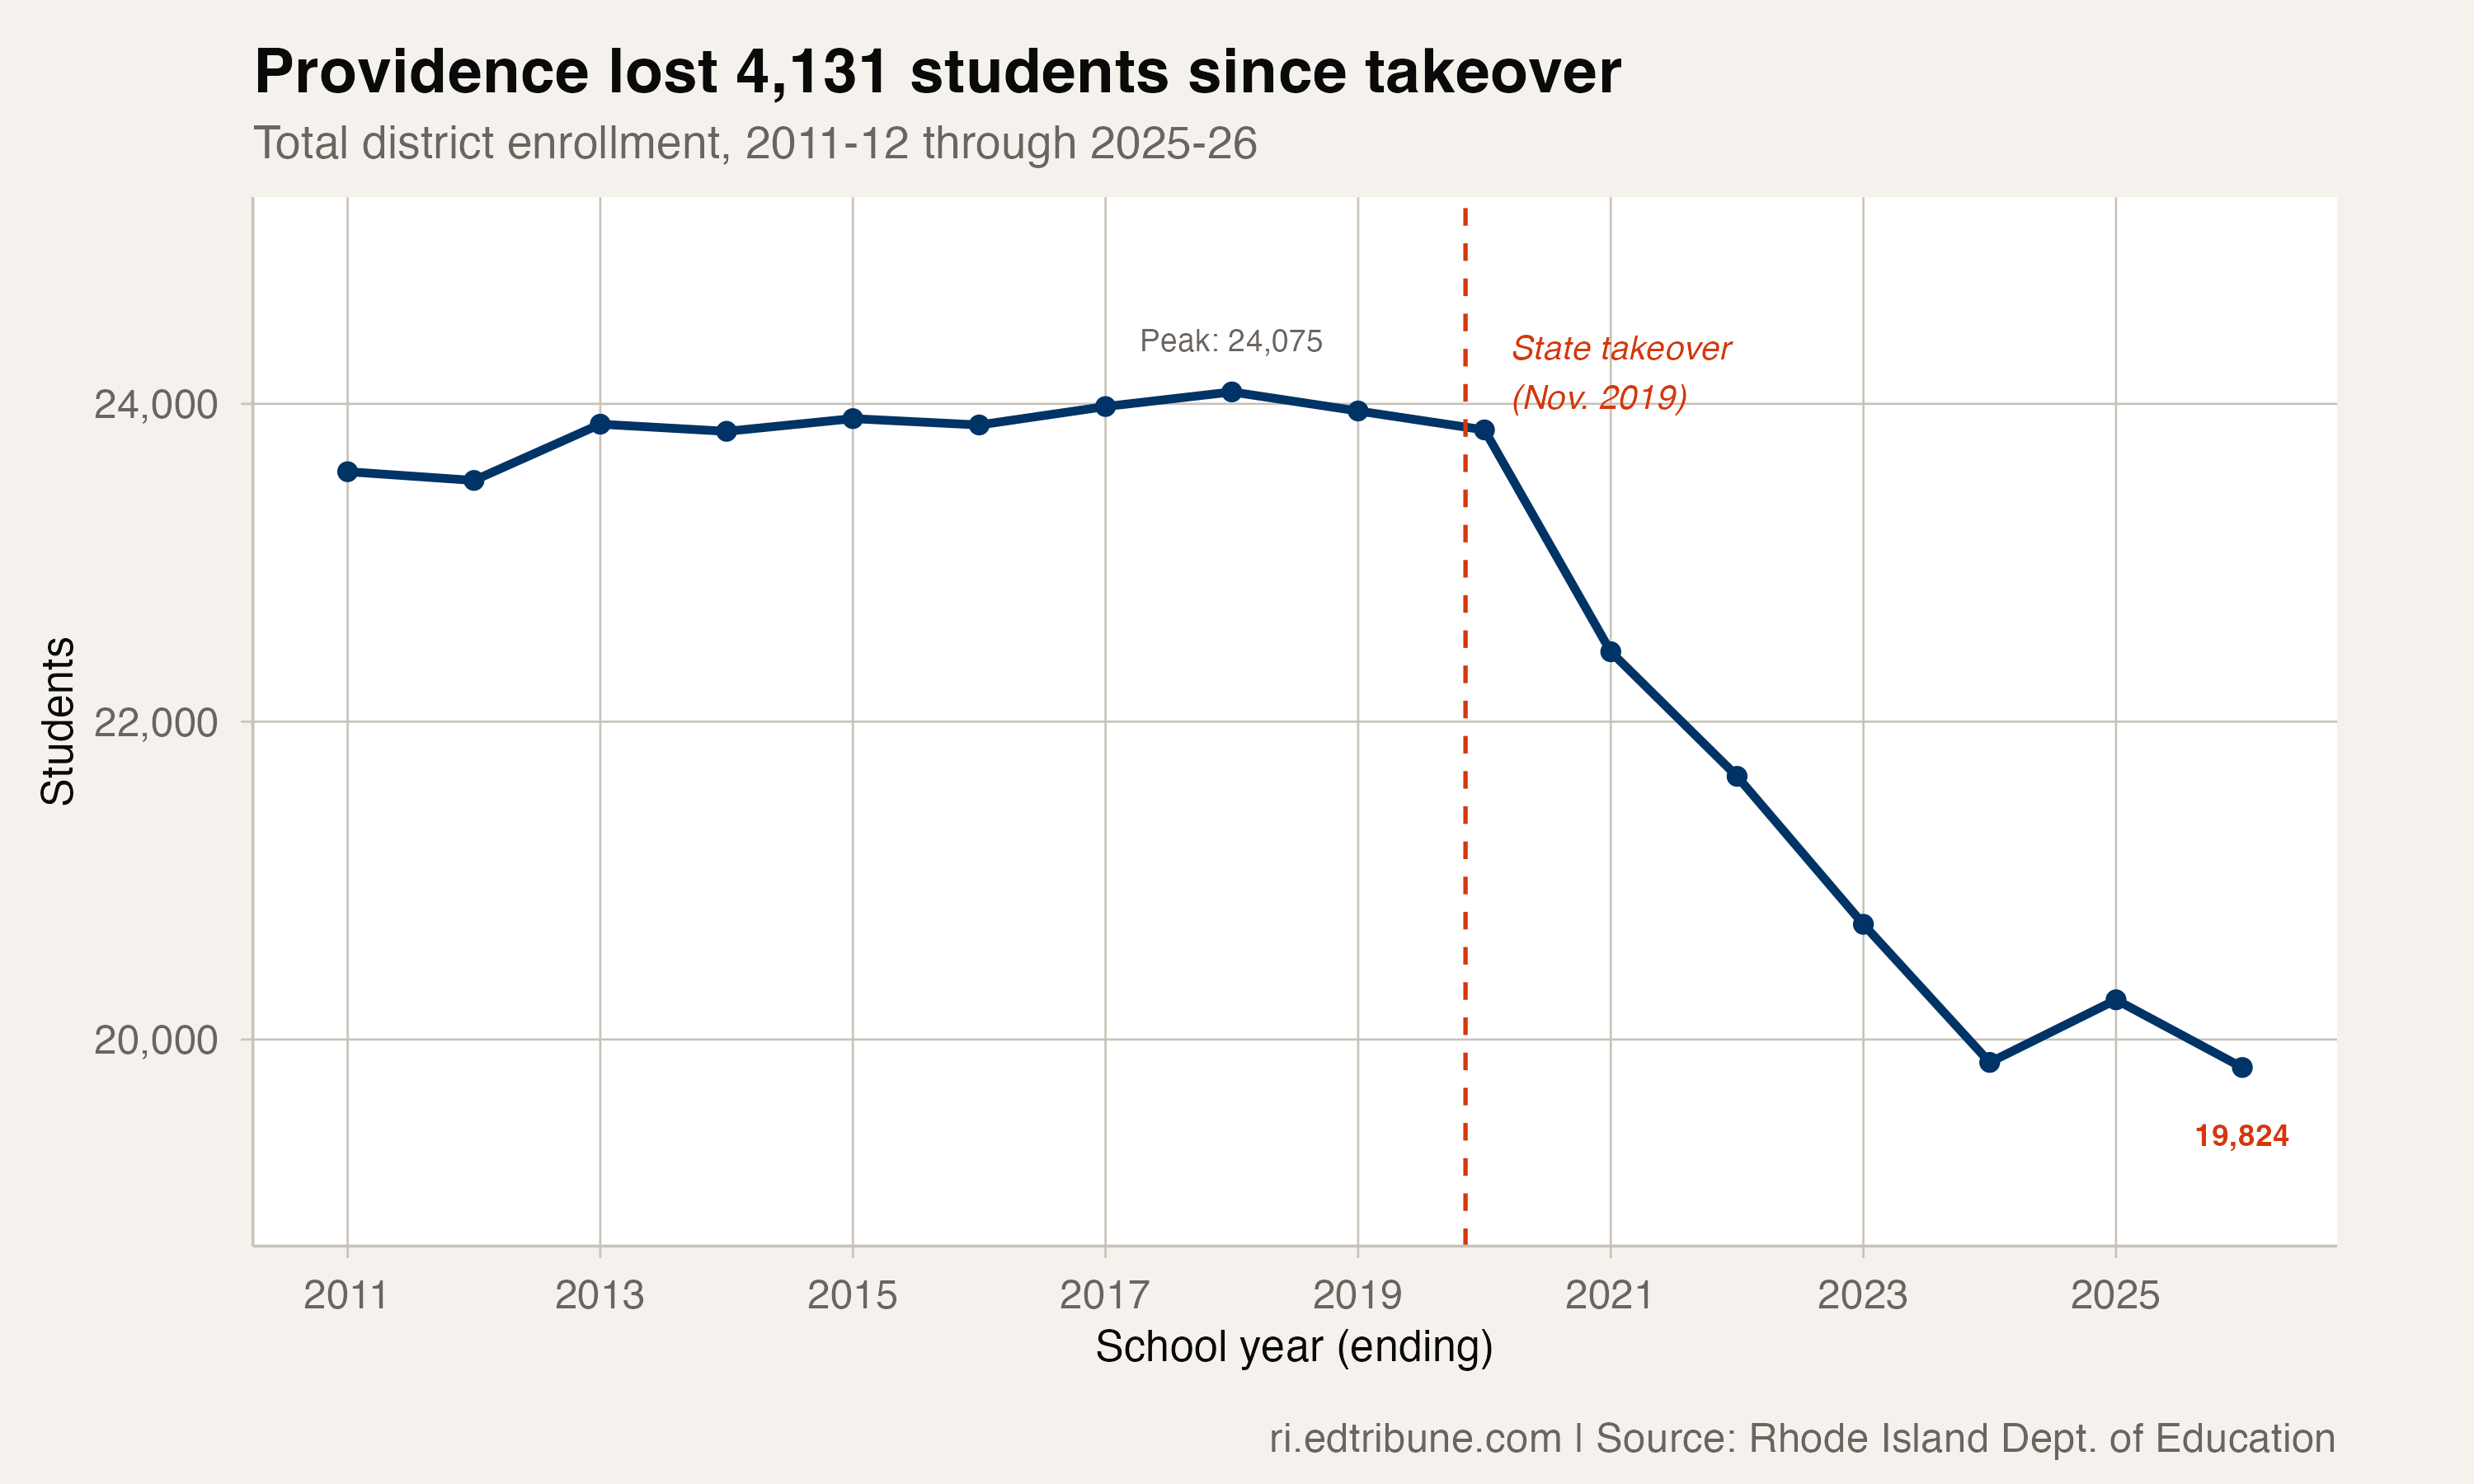
Rhode Island's Department of Education says state intervention began during the 2019-20 school year. The package reports 23,836 Providence students for that year and 19,824 in 2025-26.
That is a decline of 4,012 students, or 16.8%, across the intervention-period endpoints. The current count is also the minimum among the 16 annual Providence observations in the package panel.
A stable earlier range, then a sustained decline
The nine Providence observations through 2018-19 ranged from 23,518 to 24,075 students. The panel peak was 24,075 in 2017-18.
The 2019-20 baseline was 23,836, down 119 from the prior year. Providence then fell to 22,440 in 2020-21, a loss of 1,396. That was the largest single district-year loss anywhere in the 16-year package panel.
Enrollment declined by another 784 students in 2021-22, 931 in 2022-23, and 869 in 2023-24. It rose by 394 in 2024-25, then fell by 426 to 19,824 in 2025-26.
| Year | Providence enrollment | Annual change |
|---|---|---|
| 2019-20 | 23,836 | -119 |
| 2020-21 | 22,440 | -1,396 |
| 2021-22 | 21,656 | -784 |
| 2022-23 | 20,725 | -931 |
| 2023-24 | 19,856 | -869 |
| 2024-25 | 20,250 | +394 |
| 2025-26 | 19,824 | -426 |
The one-year increase did not persist into the current observation. The data establish that sequence; they do not establish why it occurred.
Providence fell faster than the state row
Rhode Island's authoritative state row fell from 143,557 students in 2019-20 to 133,829 in 2025-26. That was a decline of 9,728 students, or 6.8%.
Providence's 16.8% decline was 2.48 times the statewide percentage decline. Its share of statewide enrollment fell from 16.6% to 14.8%.
Those comparisons describe relative scale. They do not identify whether governance, demographics, housing, sector changes, or other mechanisms produced the different rates of decline.
Four district rows ended at panel lows
Providence was not the only selected district at its minimum package value in 2025-26. Pawtucket fell from 8,784 in 2019-20 to 7,534, a loss of 1,250 students or 14.2%.
Woonsocket fell from 6,027 to 5,280, a loss of 747 or 12.4%. Central Falls fell from 2,878 to 2,435, a loss of 443 or 15.4%. Each of the four current counts was the district's minimum in the 16-year panel.
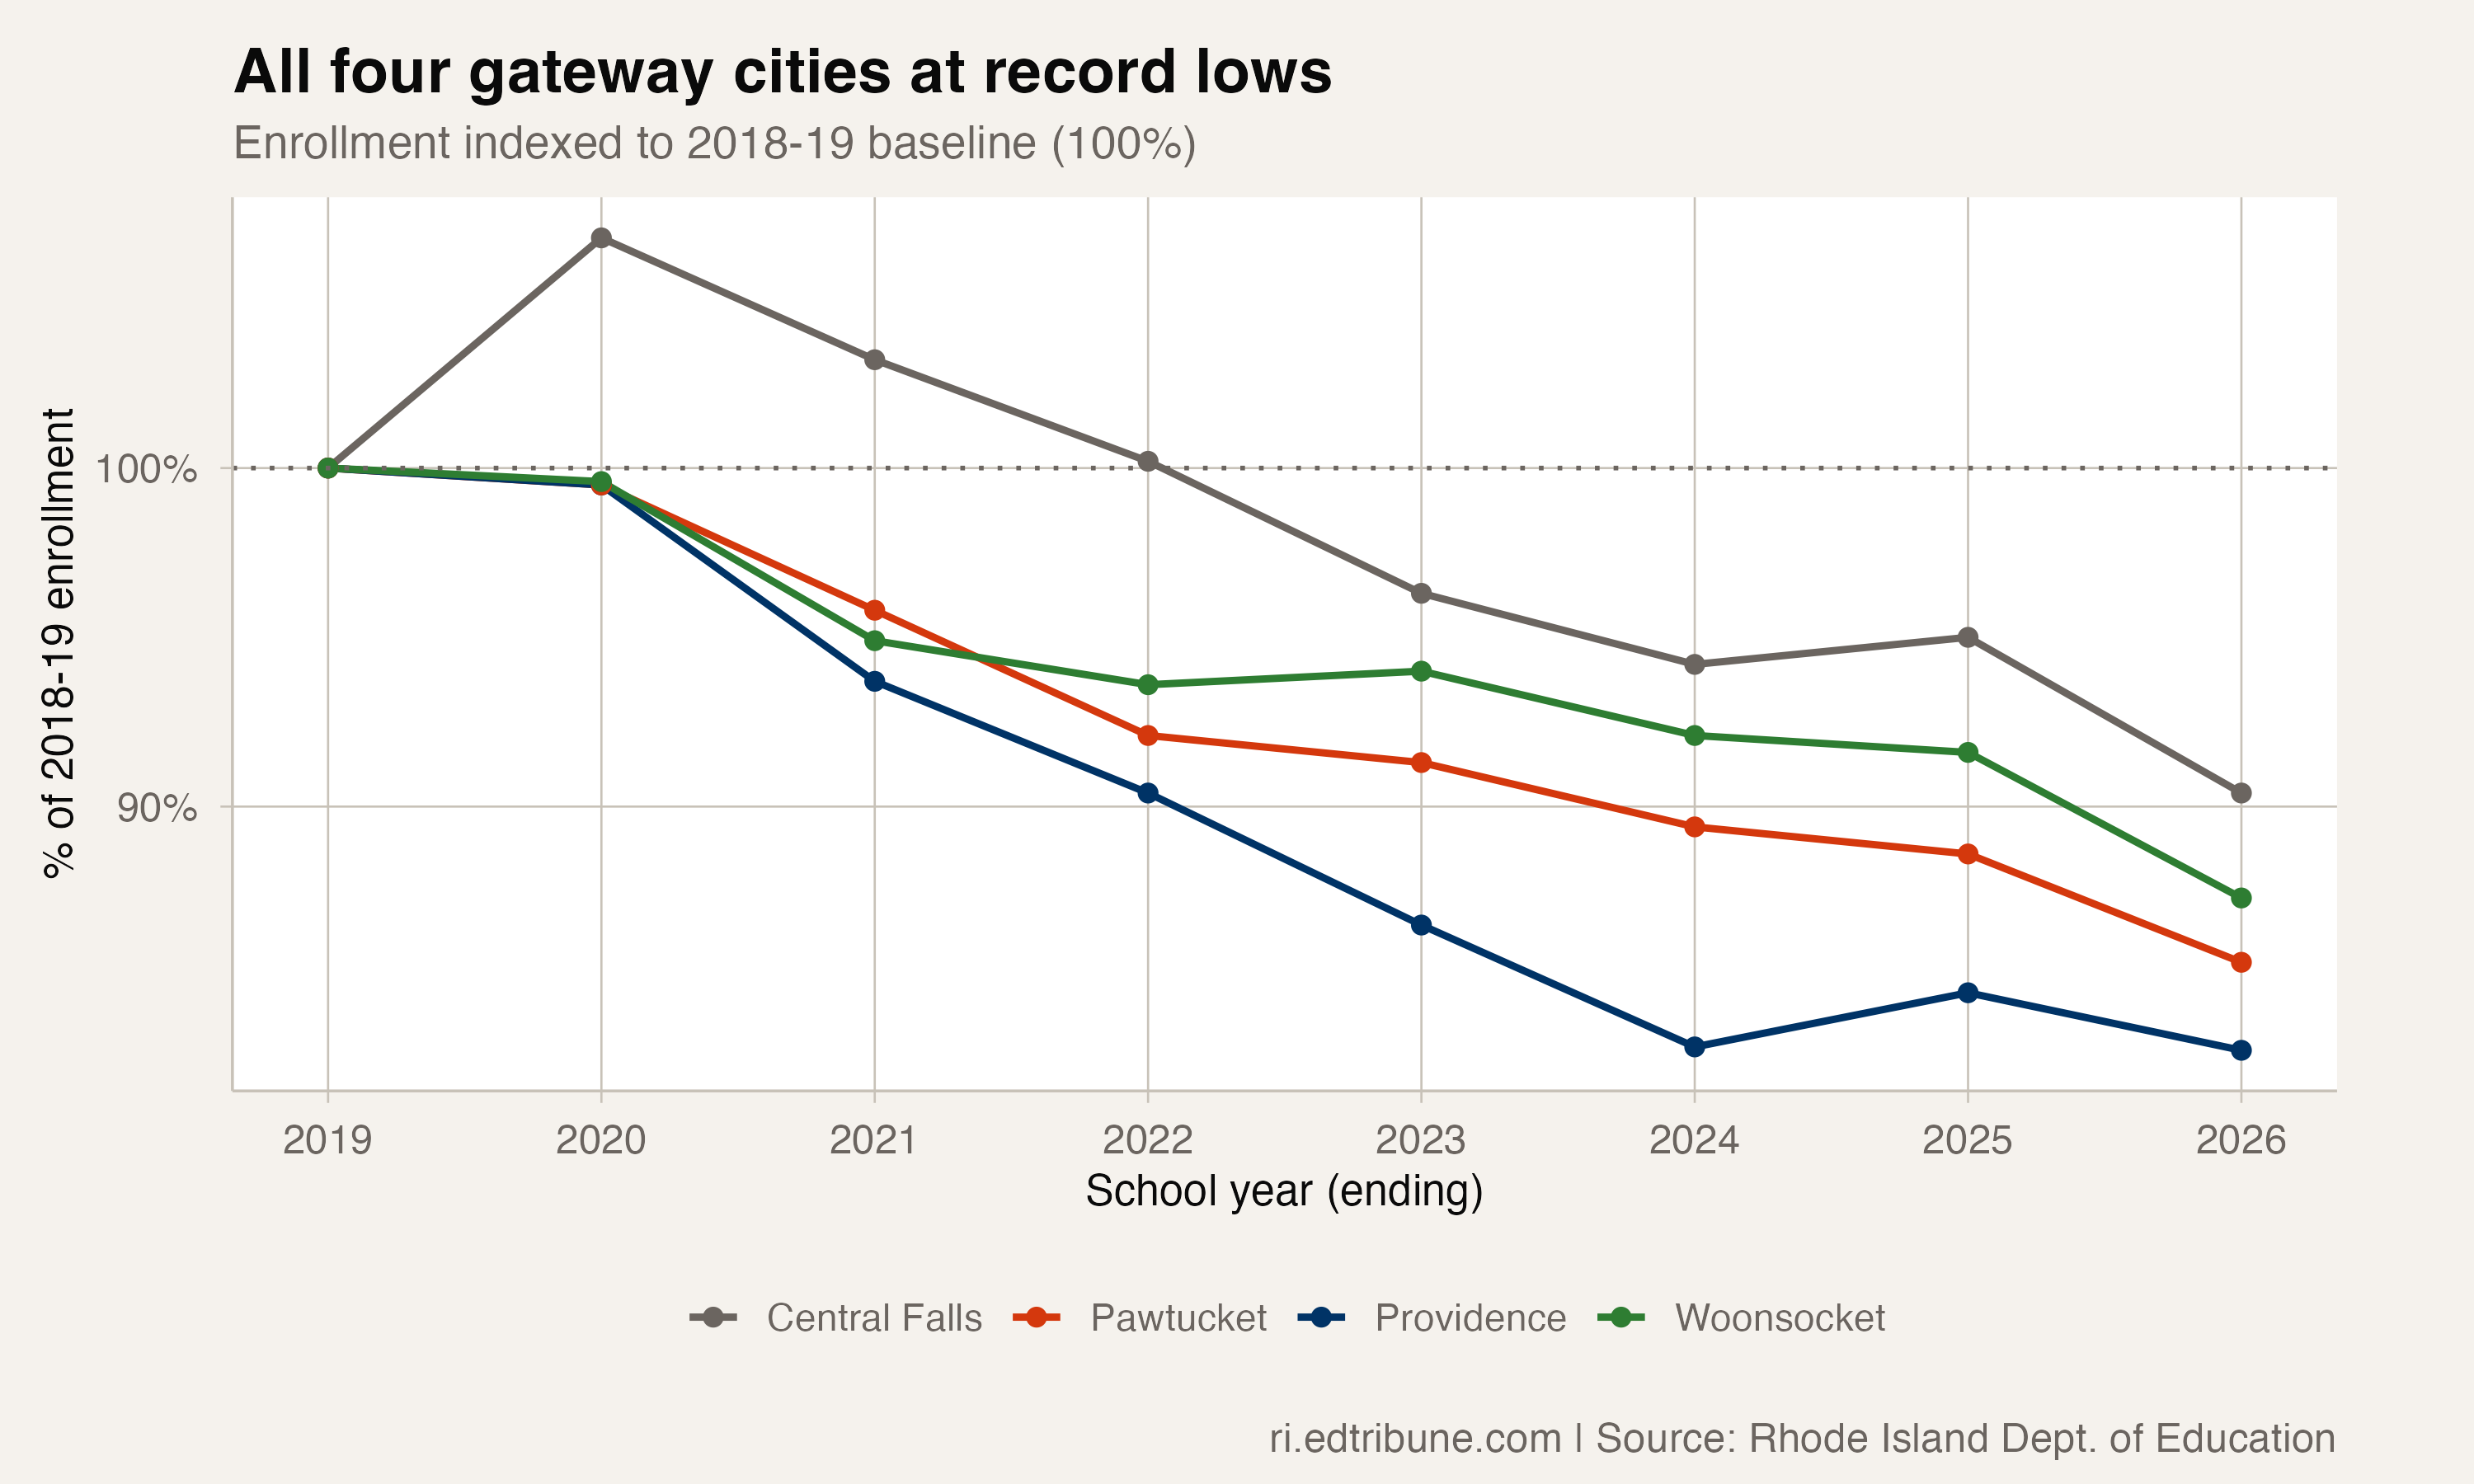
The chart uses a common index so the percentage trajectories can be compared without treating districts of different sizes as equivalent in absolute enrollment.
A parallel charter trajectory
The package's Achievement First rows summed to 1,357 students in 2019-20 and 3,244 in 2025-26. That is a gain of 1,887 students, or 139.1%.
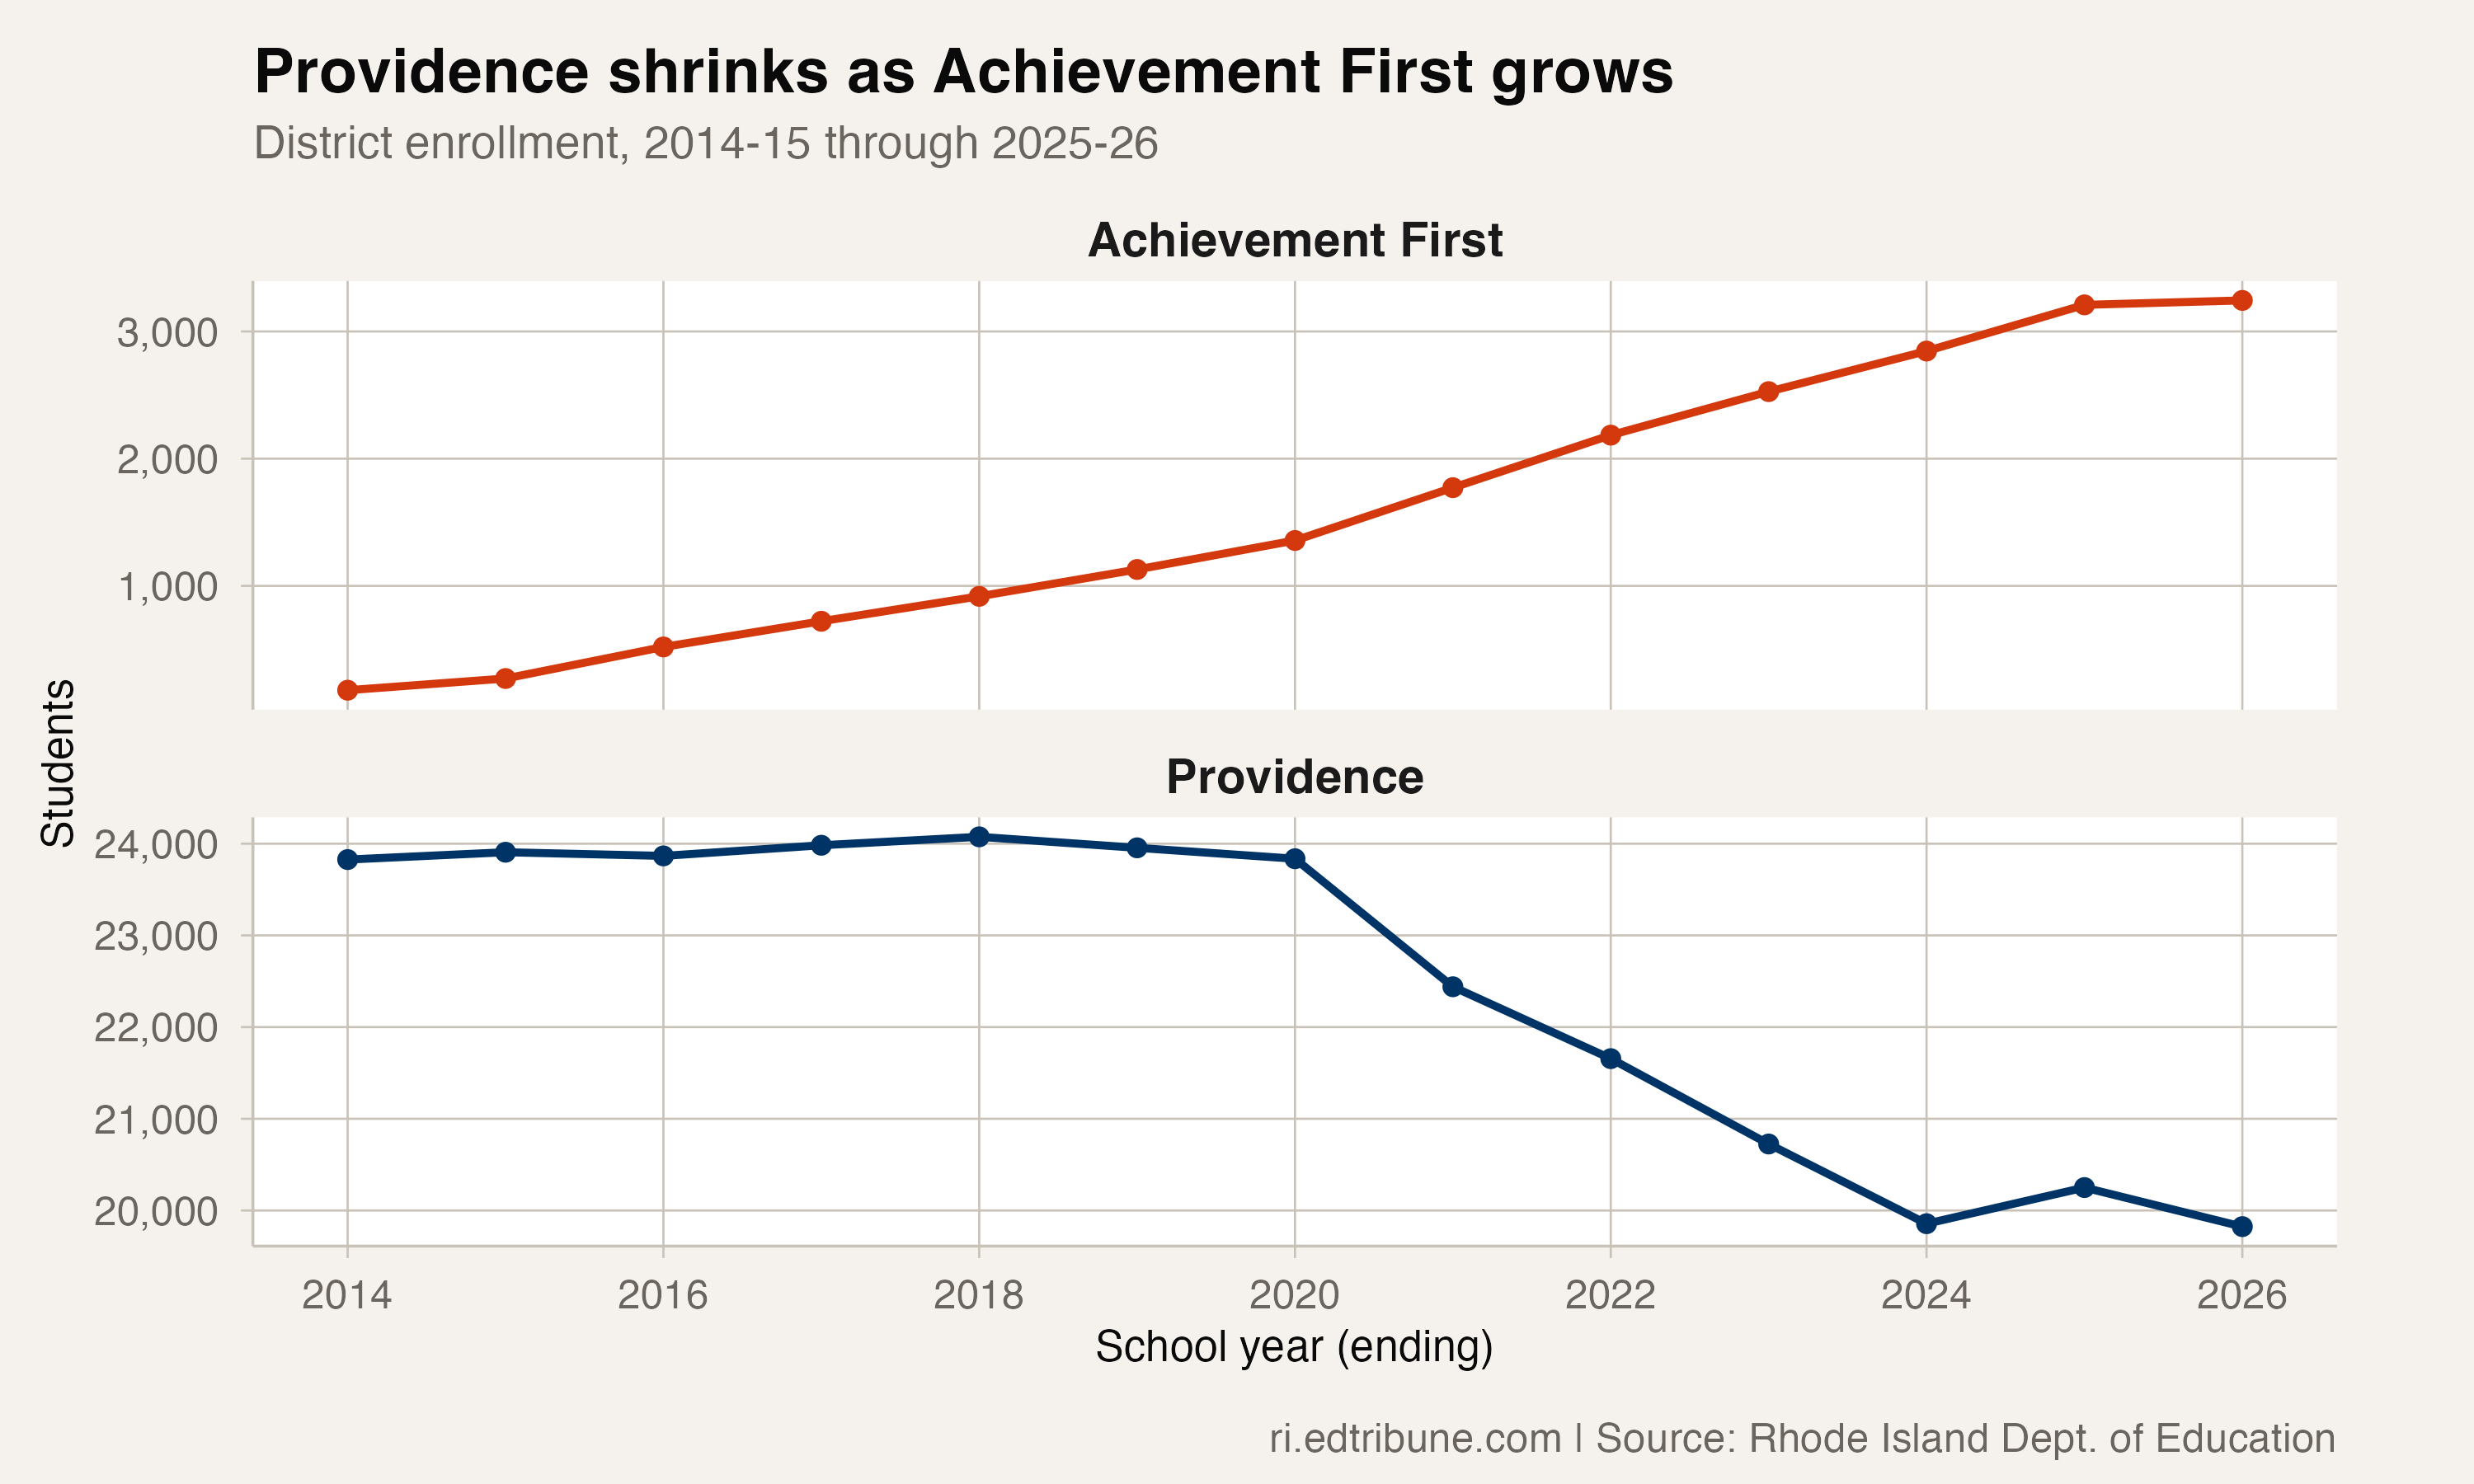
The two series moved in opposite directions, but the package does not track individual transfers. Their juxtaposition does not show that Achievement First growth caused Providence's decline or that the students gained by one series were the students lost by the other.
Intervention has concluded
RIDE has since announced the conclusion of state intervention and the district's transition to local control. The enrollment data cannot evaluate the intervention's academic effects or assign the enrollment decline to governance.
What the executed package can establish is narrower: Providence lost 4,012 students, or 16.8%, from the 2019-20 baseline to 2025-26, ended at a 16-year panel low, and declined faster than the state row over the same endpoints.
Detailed code that reproduces the analysis and figures in this article is available exclusively to EdTribune subscribers.
Discussion
Sign in to join the discussion.
Loading comments...