In this series: Rhode Island 2025-26 Enrollment.
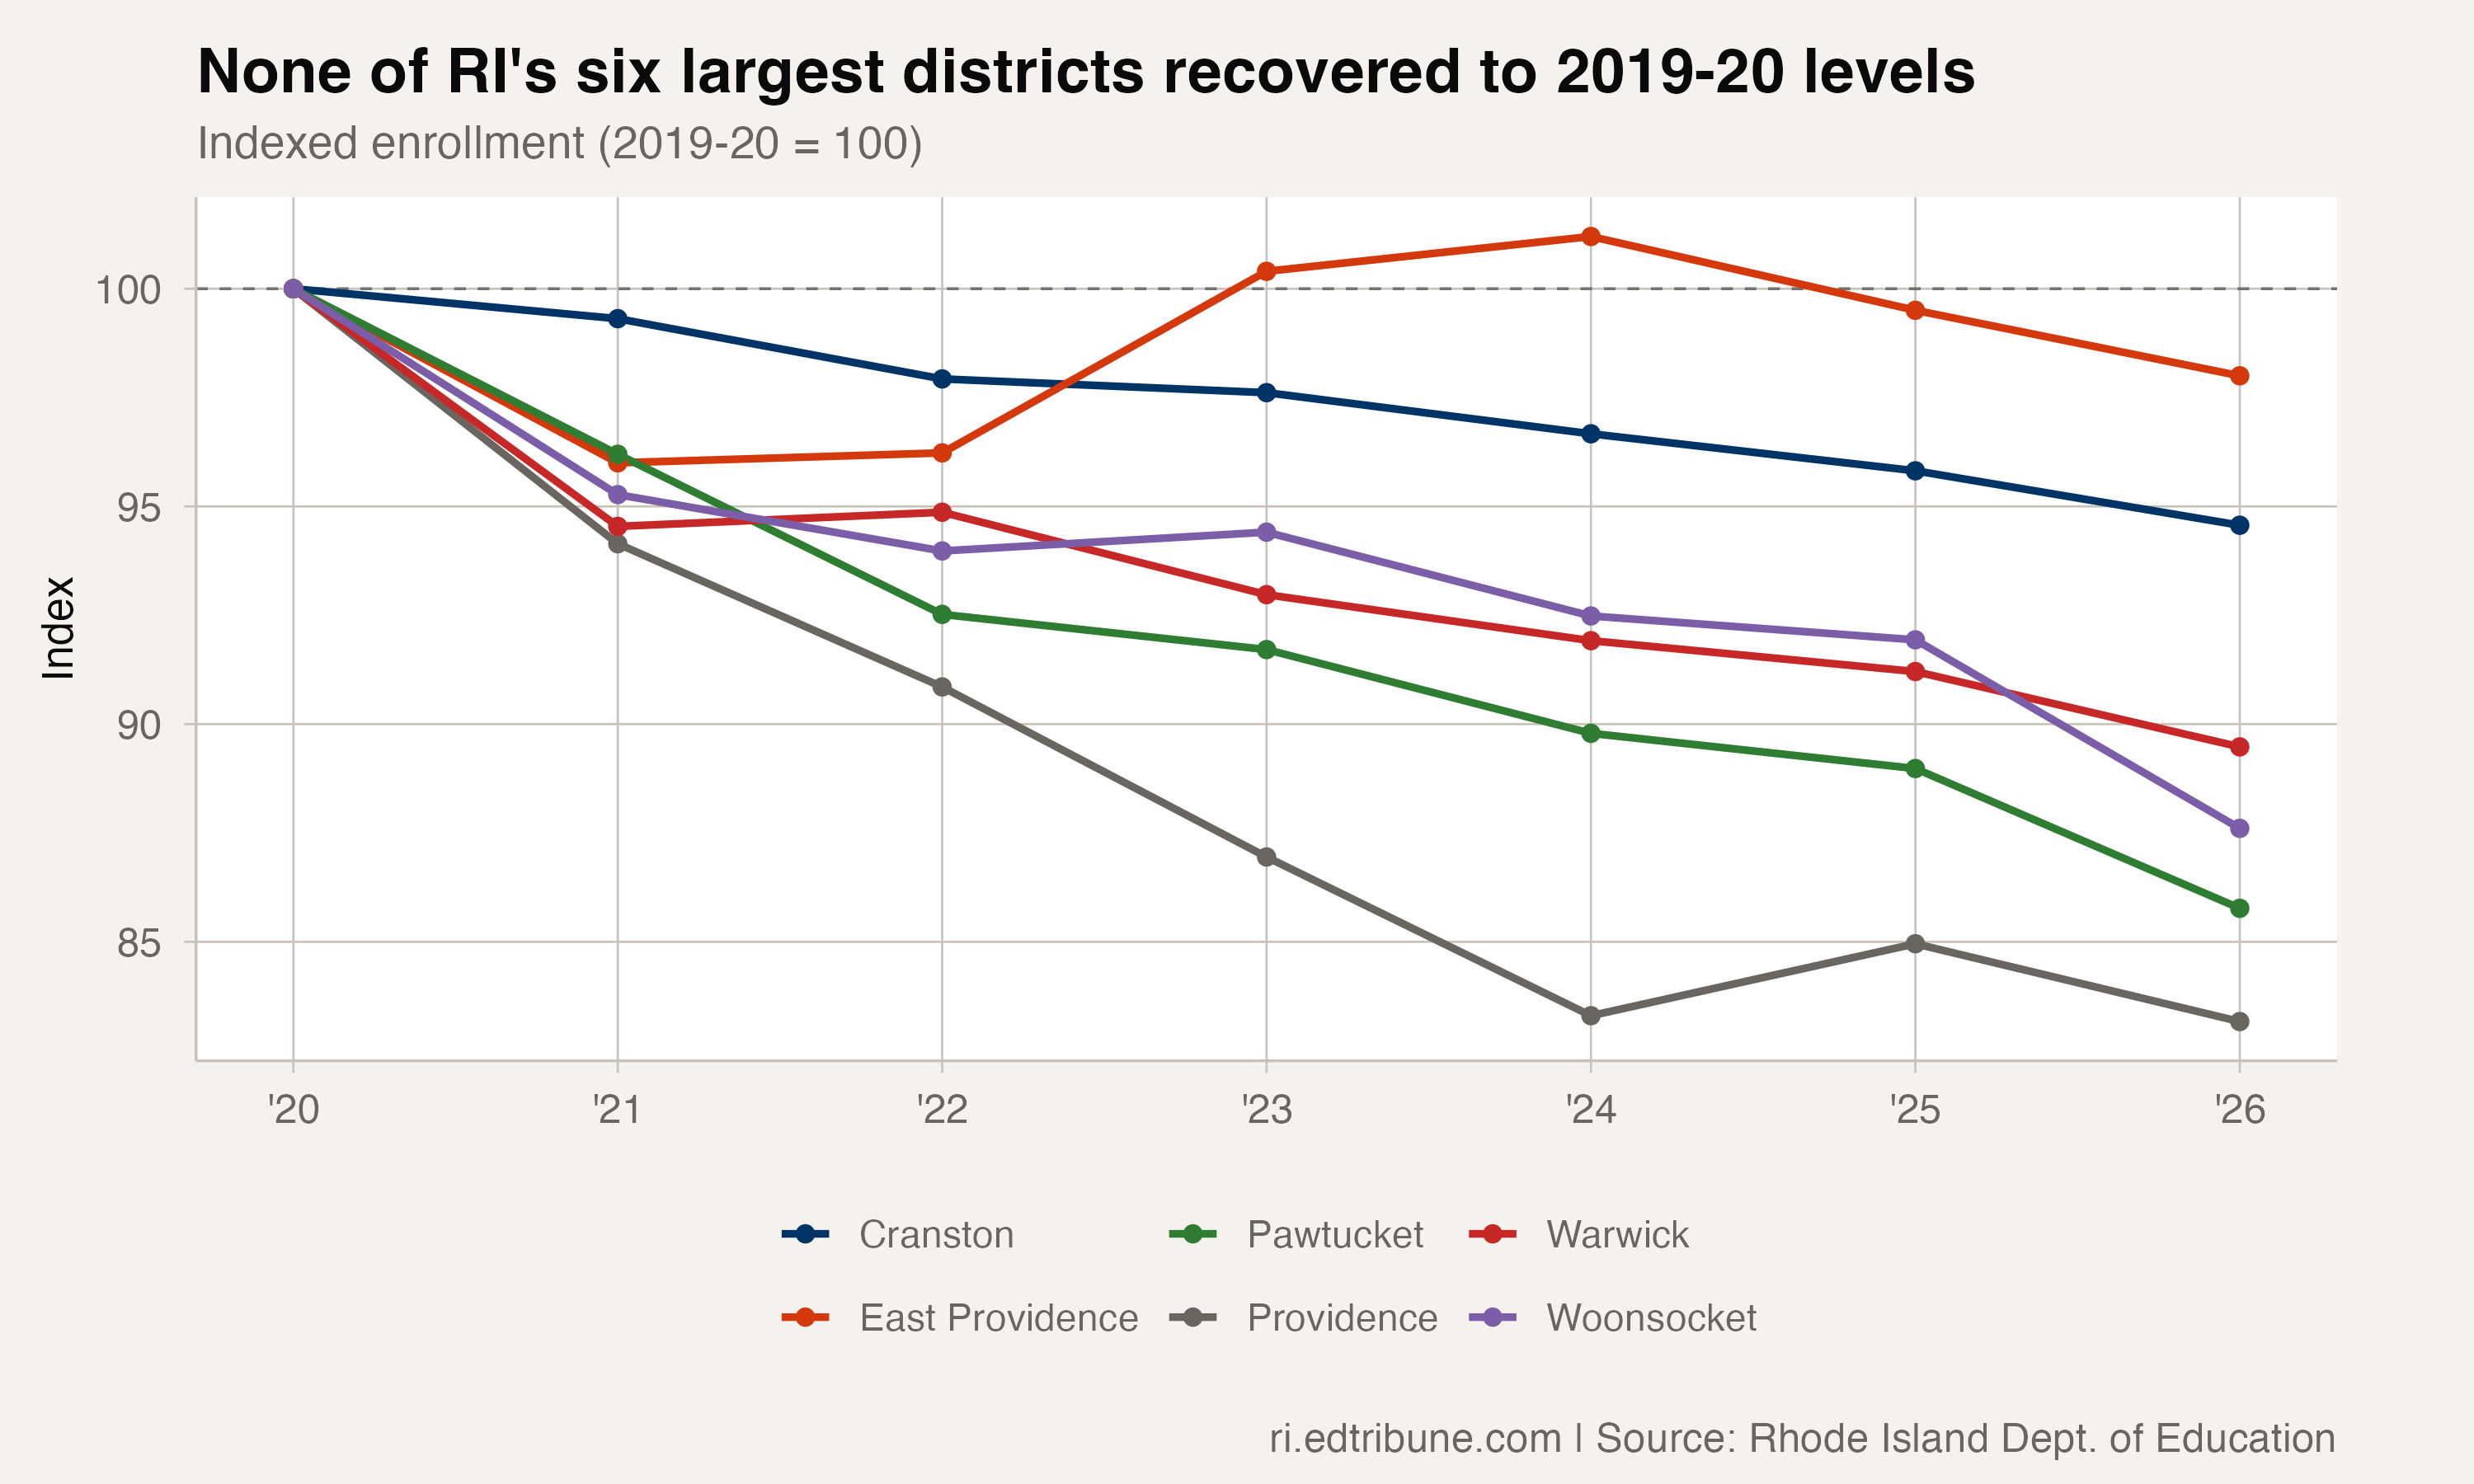
Five years after the pandemic emptied classrooms across Rhode Island, not one of the state’s six largest traditional districts has climbed back to where it started. Providence, Cranston, Pawtucket, Warwick, Woonsocket, East Providence — zero for six.
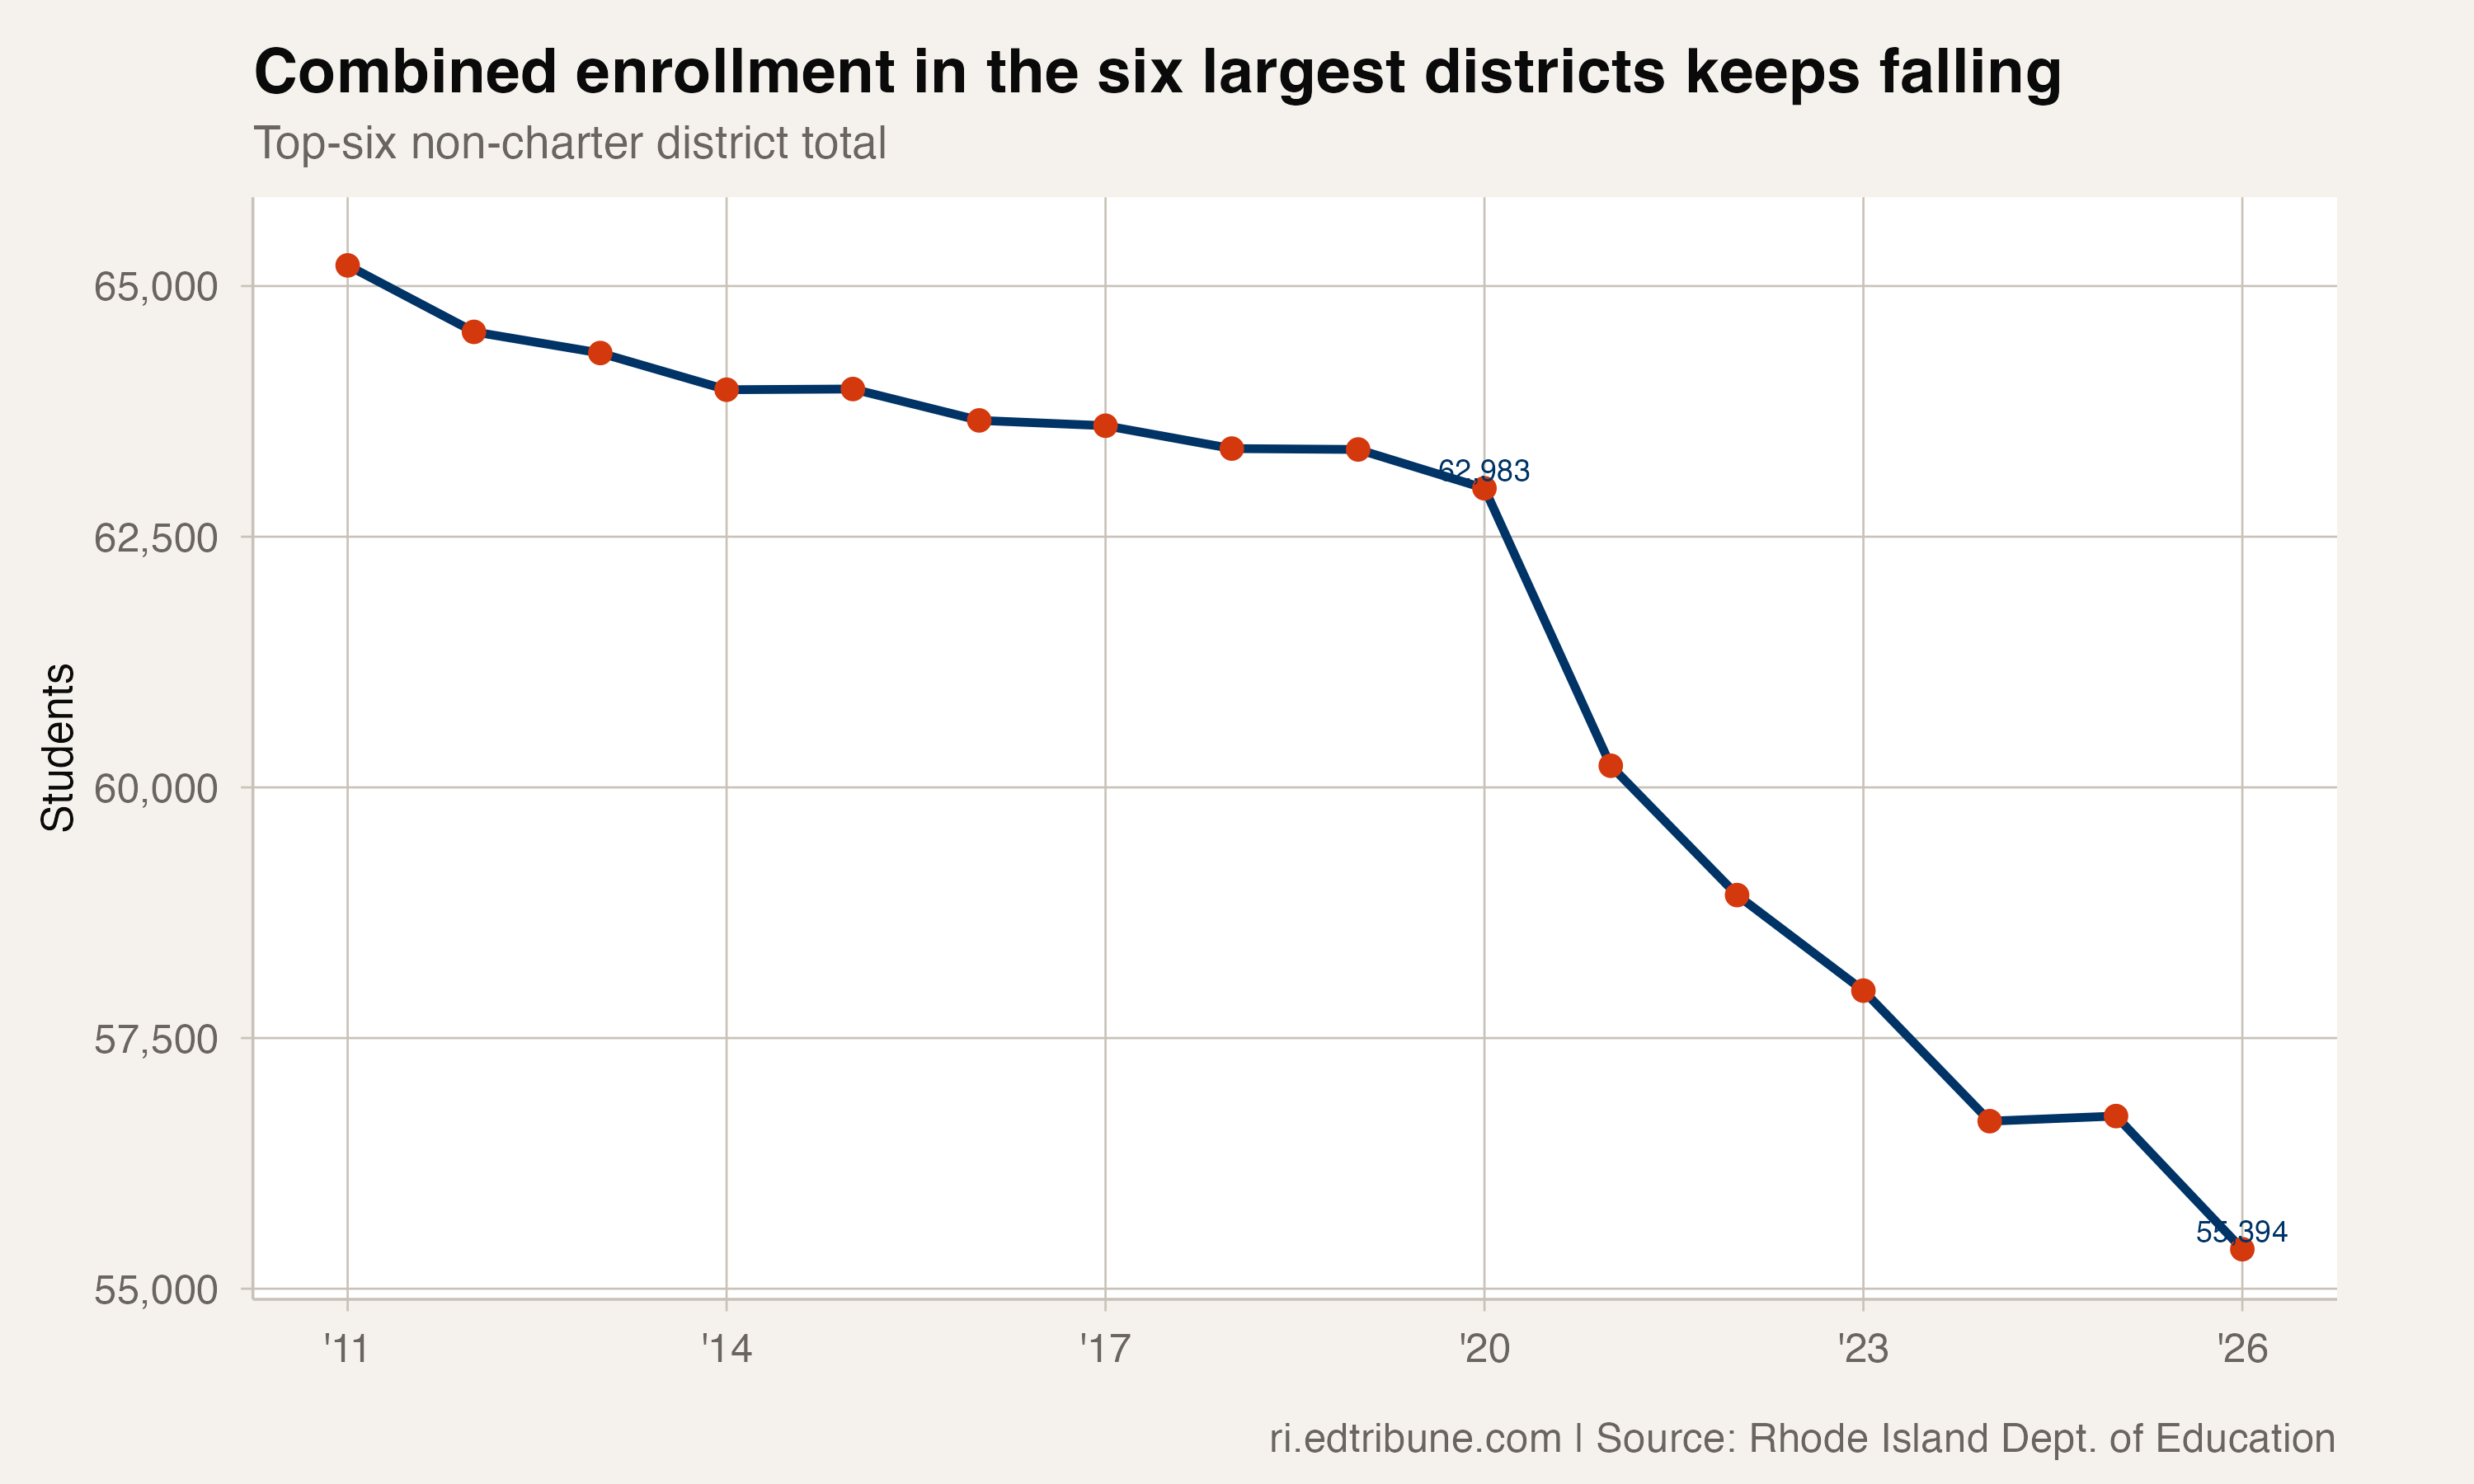
Combined, these districts enrolled 62,983 students in 2019-20. By 2025-26, that number had fallen to 55,394 — a loss of 7,589 students, or 12.0%. The hole keeps getting deeper, not shallower.
A broad collapse, not a Providence problem
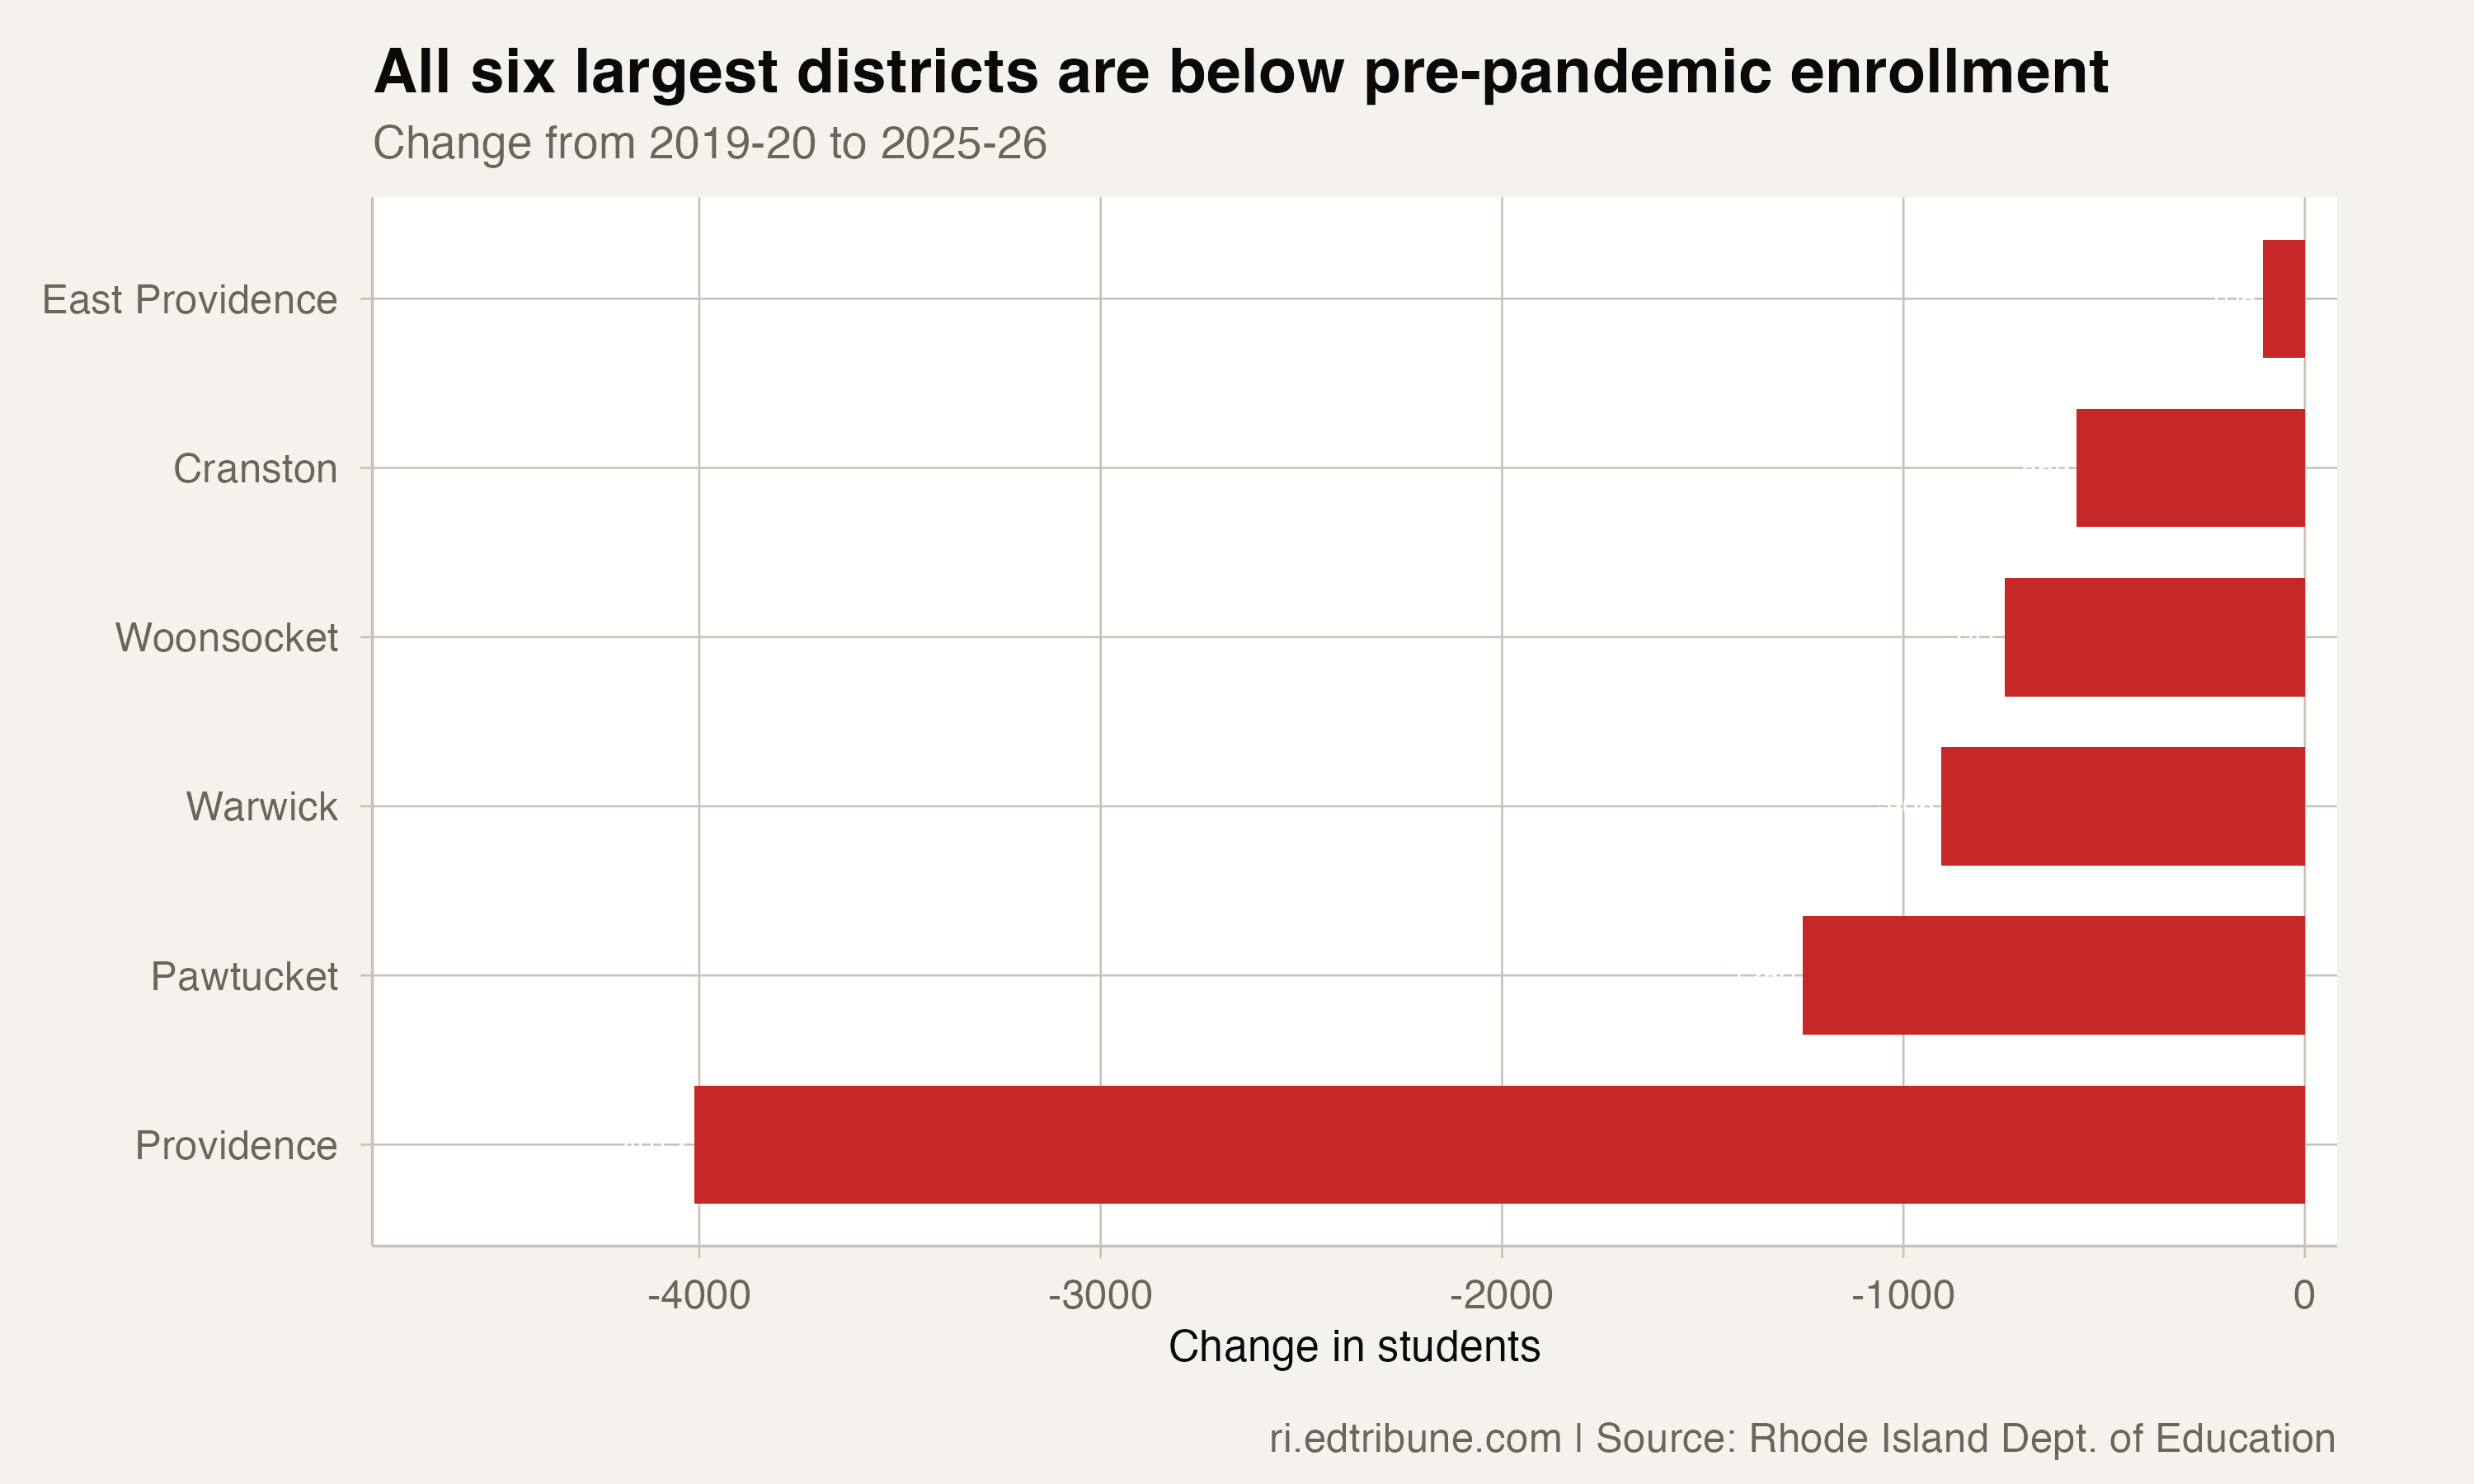
It would be easy to pin this on Providence, which accounts for more than half the total decline at -4,012 students (-16.8%). But every other district on the list is also still underwater. The gateway cities are at all-time lows. The smaller cities on this list — Woonsocket (-12.4%), Warwick (-10.5%) — are dealing with proportional losses nearly as severe.
Zero of the six largest traditional districts have returned to their 2019-20 enrollment level. The recovery count is not low — it is zero.
| District | 2019-20 | 2025-26 | Change | % change |
|---|---|---|---|---|
| Providence | 23,836 | 19,824 | -4,012 | -16.8% |
| Cranston | 10,475 | 9,906 | -569 | -5.4% |
| Pawtucket | 8,784 | 7,534 | -1,250 | -14.2% |
| Warwick | 8,610 | 7,704 | -906 | -10.5% |
| Woonsocket | 6,027 | 5,280 | -747 | -12.4% |
| East Providence | 5,251 | 5,146 | -105 | -2.0% |
East Providence comes closest to its baseline, down just 105 students (-2.0%). Cranston, the second-largest district, sits 569 students below its pre-pandemic count. Neither is close enough to call a recovery.
What the data can and cannot explain
The enrollment file shows what happened. It does not show why. The consistent pattern across all six large districts — urban and suburban, state-controlled and locally governed — points to system-level pressure rather than a single-district anomaly. But the data cannot decompose how much of each district’s decline reflects families leaving Rhode Island, students switching to non-public options, inter-district transfers, or simply smaller birth cohorts aging into kindergarten.
That ambiguity matters. Providence is operating under state intervention with its own set of enrollment pressures. Warwick’s demographics look nothing like Woonsocket’s. Treating the six districts as a monolith risks papering over distinct local stories with a tidy statewide narrative.
What is not ambiguous: six years into a consecutive decline streakET, the state’s largest systems have not turned a corner.
Budget math that does not add up
Nearly 7,600 fewer students in these six districts is not an abstraction. Rhode Island’s funding formula ties state aid to headcount. When enrollment drops and stays down, revenue shrinks — but buildings, bus routes, and collective bargaining agreements do not shrink on the same schedule.
For districts already stretched thin, the question is shifting from "when will enrollment recover?" to "what do we do if it doesn’t?" That can mean consolidating schools, cutting programs, or renegotiating staffing ratios — none of which happens quietly in communities that see their neighborhood school as a civic anchor.
Looking ahead
The 2026 enrollment drop was the worst single-year decline since the pandemic, which suggests the bleeding has not slowed. If anything, the trajectory for the state’s largest districts is steepening. The 2026-27 enrollment data, expected in fall 2026, will show whether any of these six districts can finally reverse course — or whether the zero-for-six record holds for another year.
Detailed code that reproduces the analysis and figures in this article is available exclusively to EdTribune subscribers.
Discussion
Sign in to join the discussion.
Loading comments...