In this series: Rhode Island 2025-26 Enrollment.
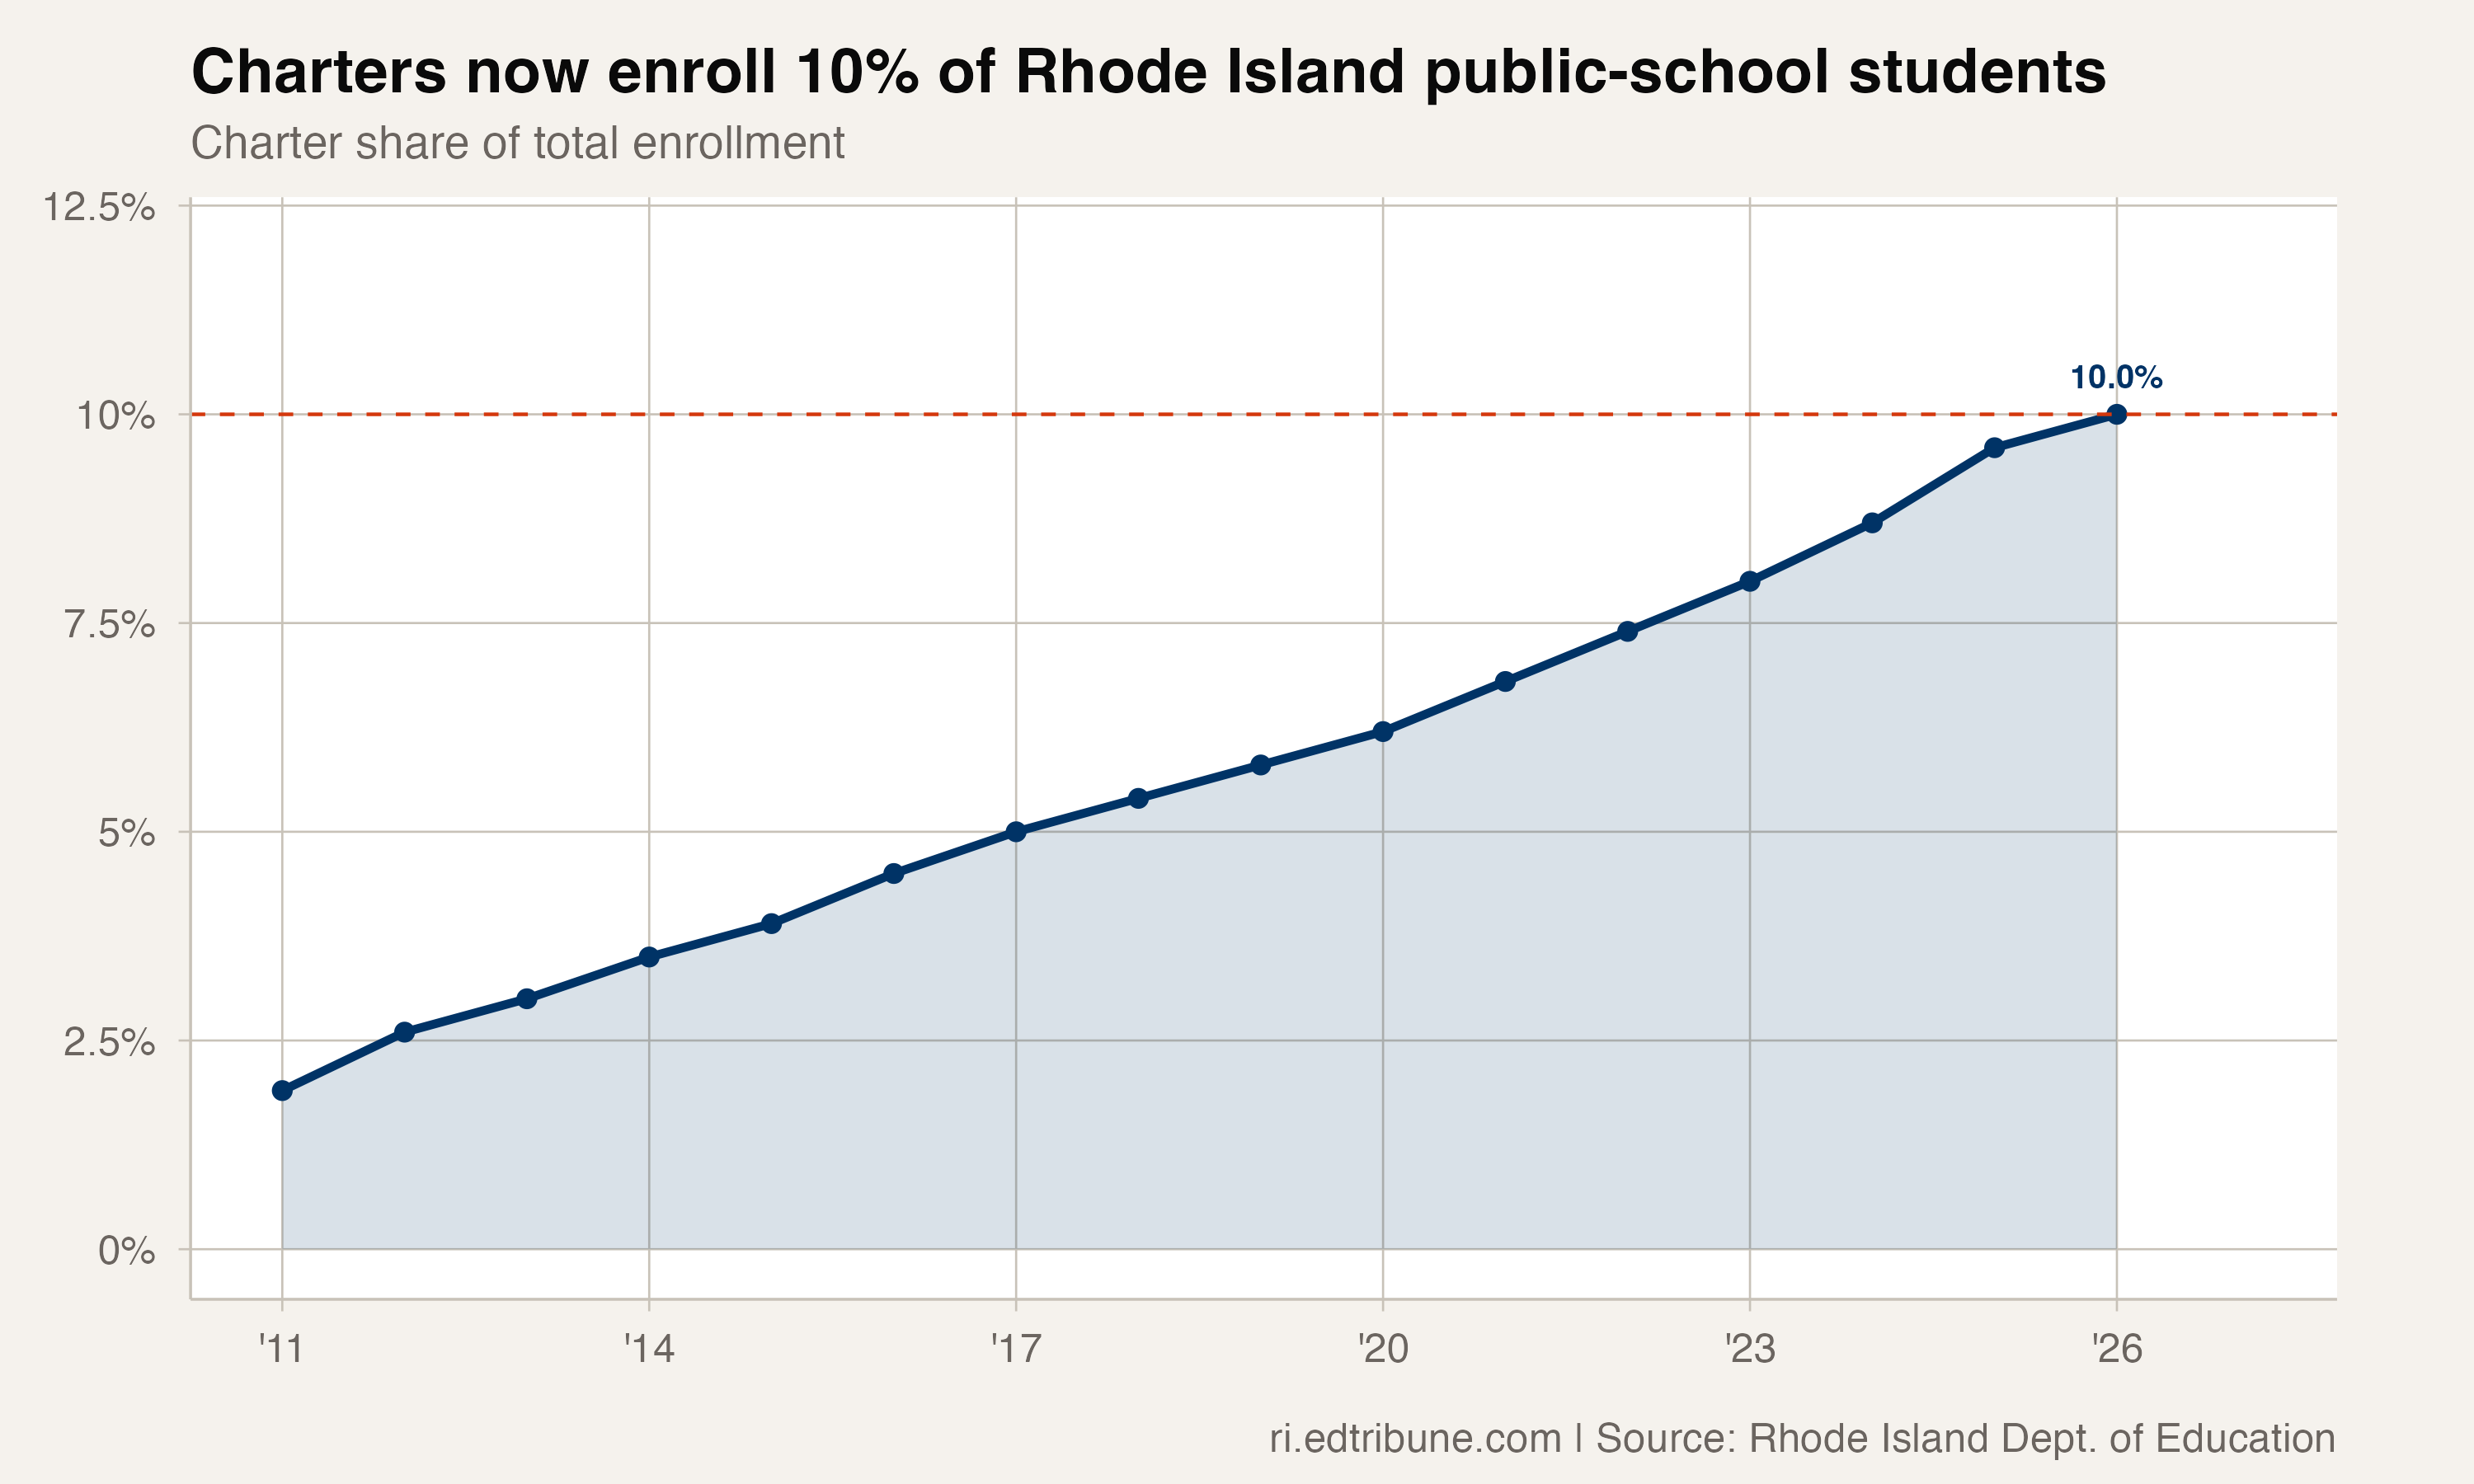
One in ten Rhode Island public-school students now attends a charter school. That line was crossed quietly in 2025-26, when charter enrollment reached 13,441 across 25 districts — up from 2,741 students in just 12 charter schools fifteen years ago. The number itself is round and tidy. What it represents is not.
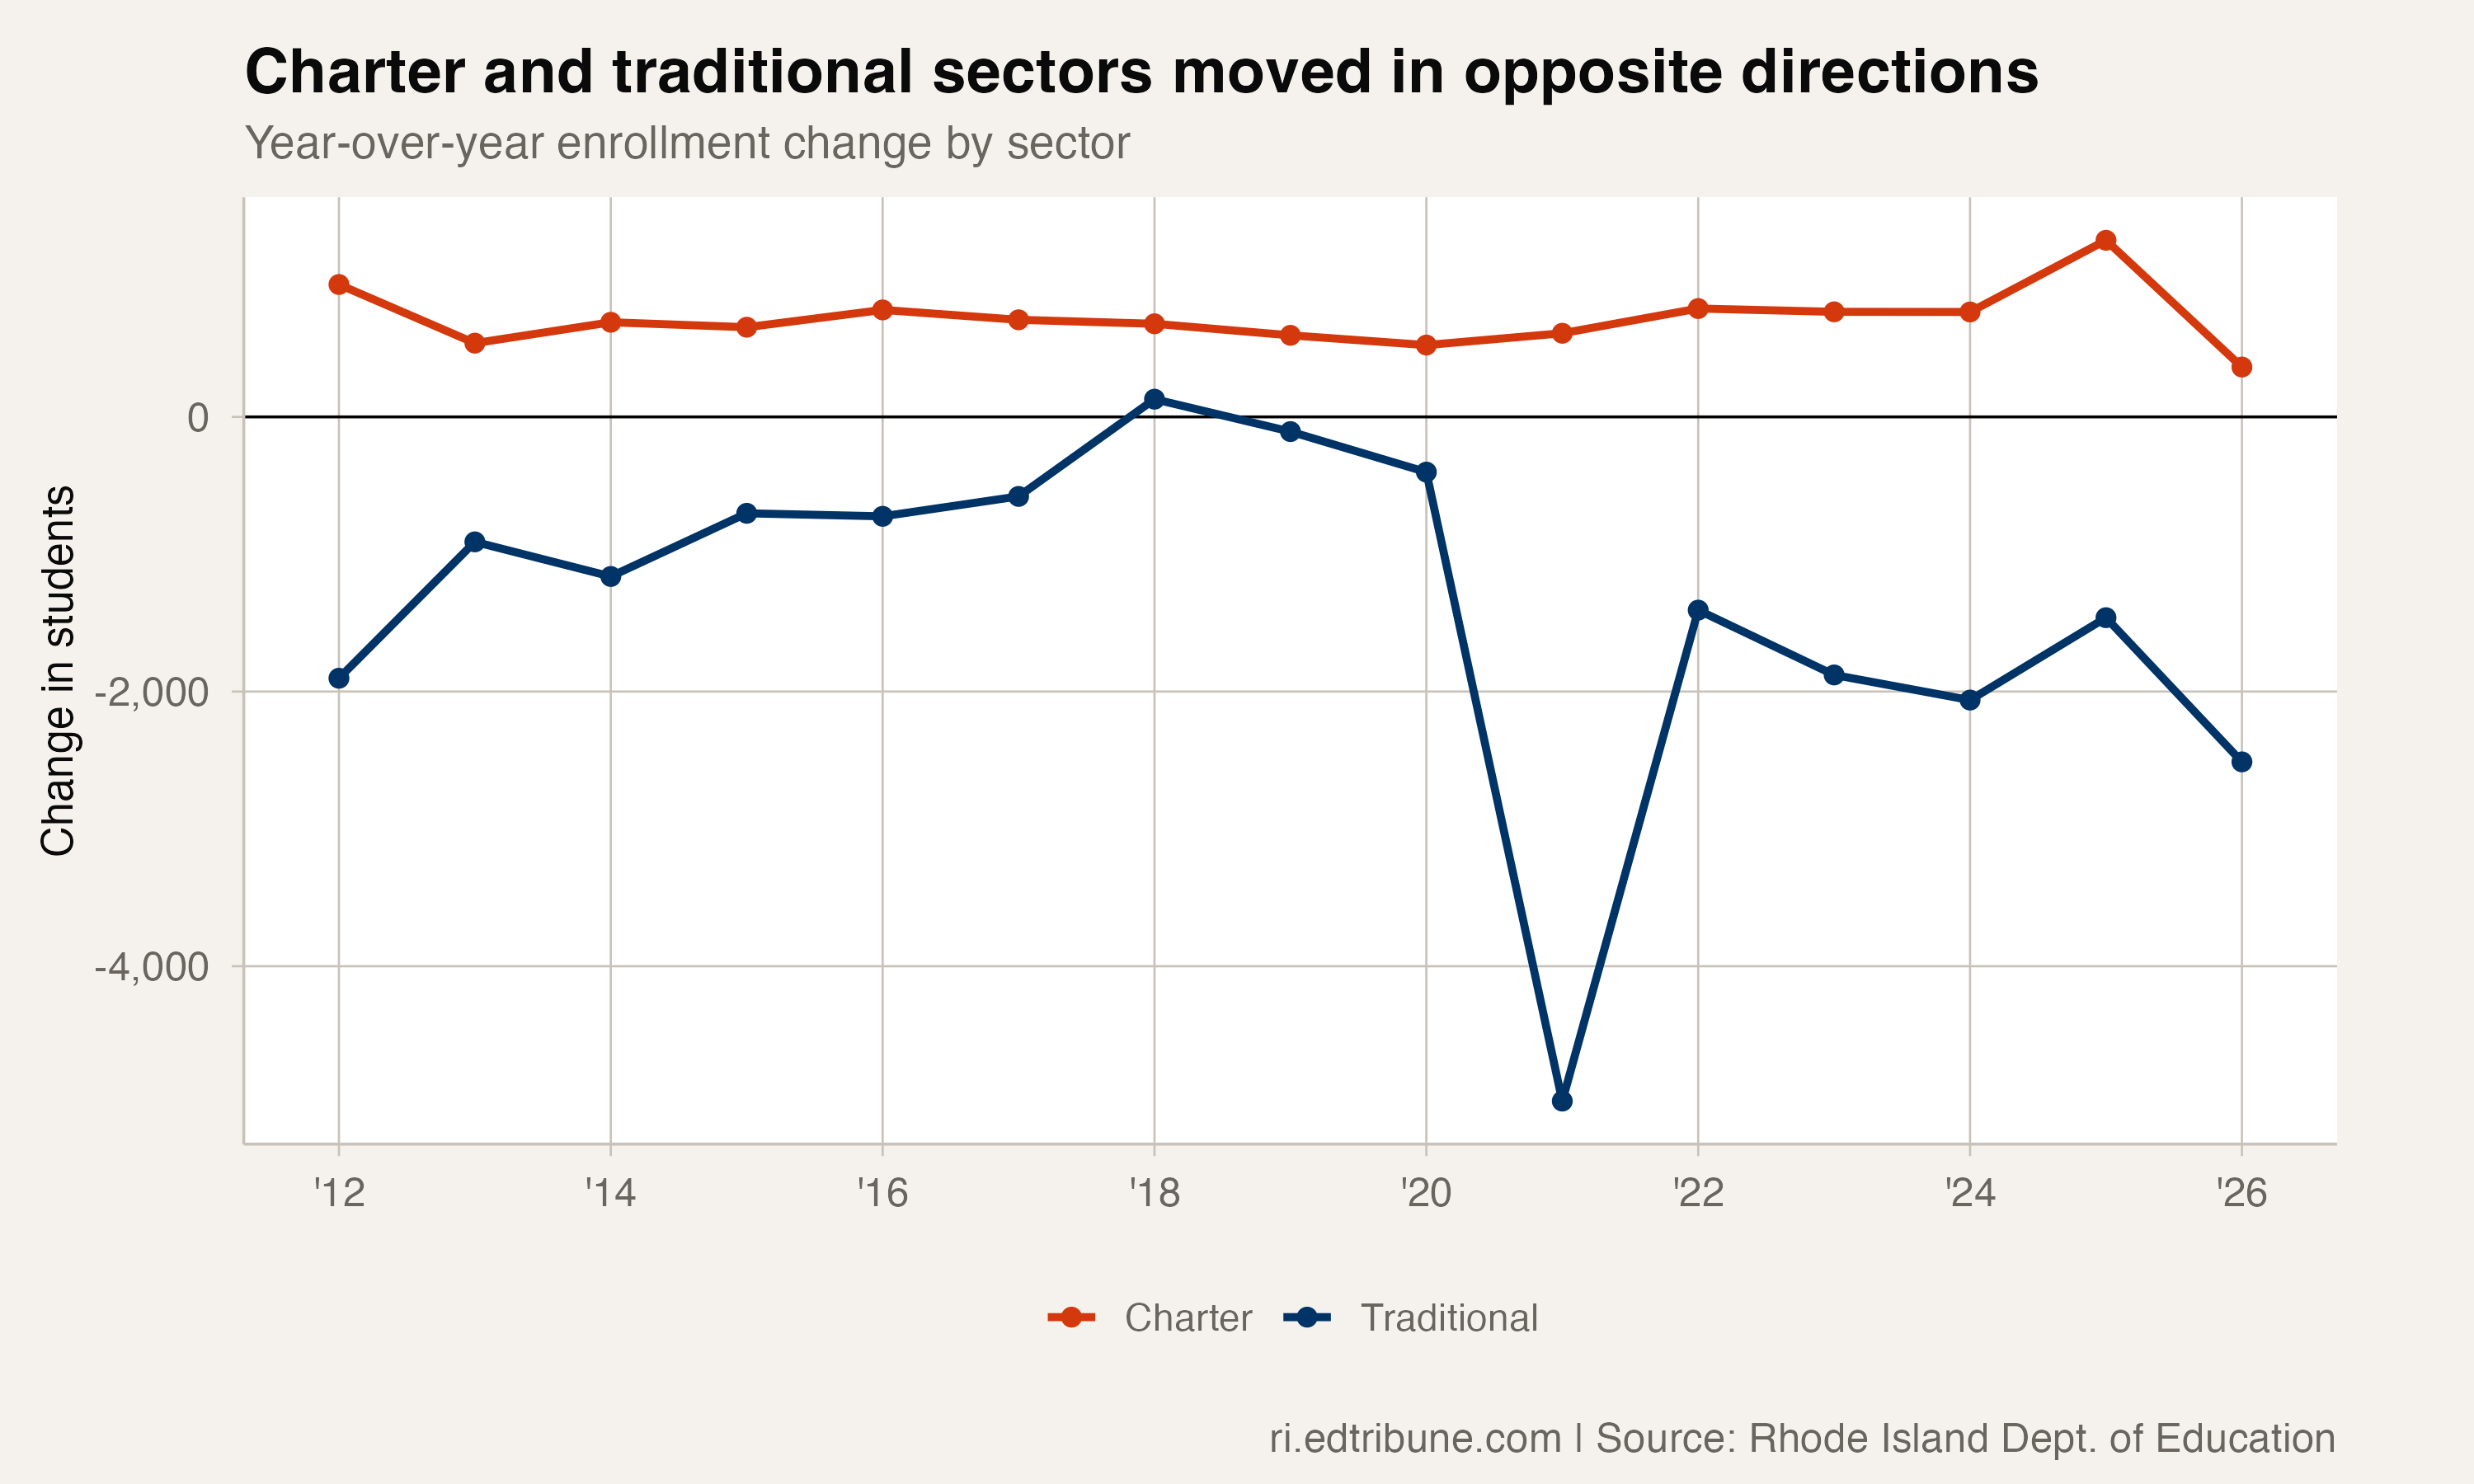
On the other side of the ledger, traditional district enrollment fell from 141,052 to 120,388 since 2010-11 (-20,664; -14.6%). Charter growth and traditional decline have been running in opposite directions for most of the past decade and a half, but calling one the cause of the other is more complicated than it looks.
Growth that came in bursts, not a straight line
Charter expansion has been uneven. Annual gains spiked in 2024-25 (+1,286; +10.9%), then cooled sharply in 2025-26 (+363; +2.8%). The sector is still growing, but at a pace that would have been unremarkable a few years ago.
The deceleration matters for planning. At 10% share, charter seat decisions are no longer marginal to statewide enrollment math. When charter share rises while total enrollment falls, districts find themselves managing two problems at once: shrinkage and reallocation.
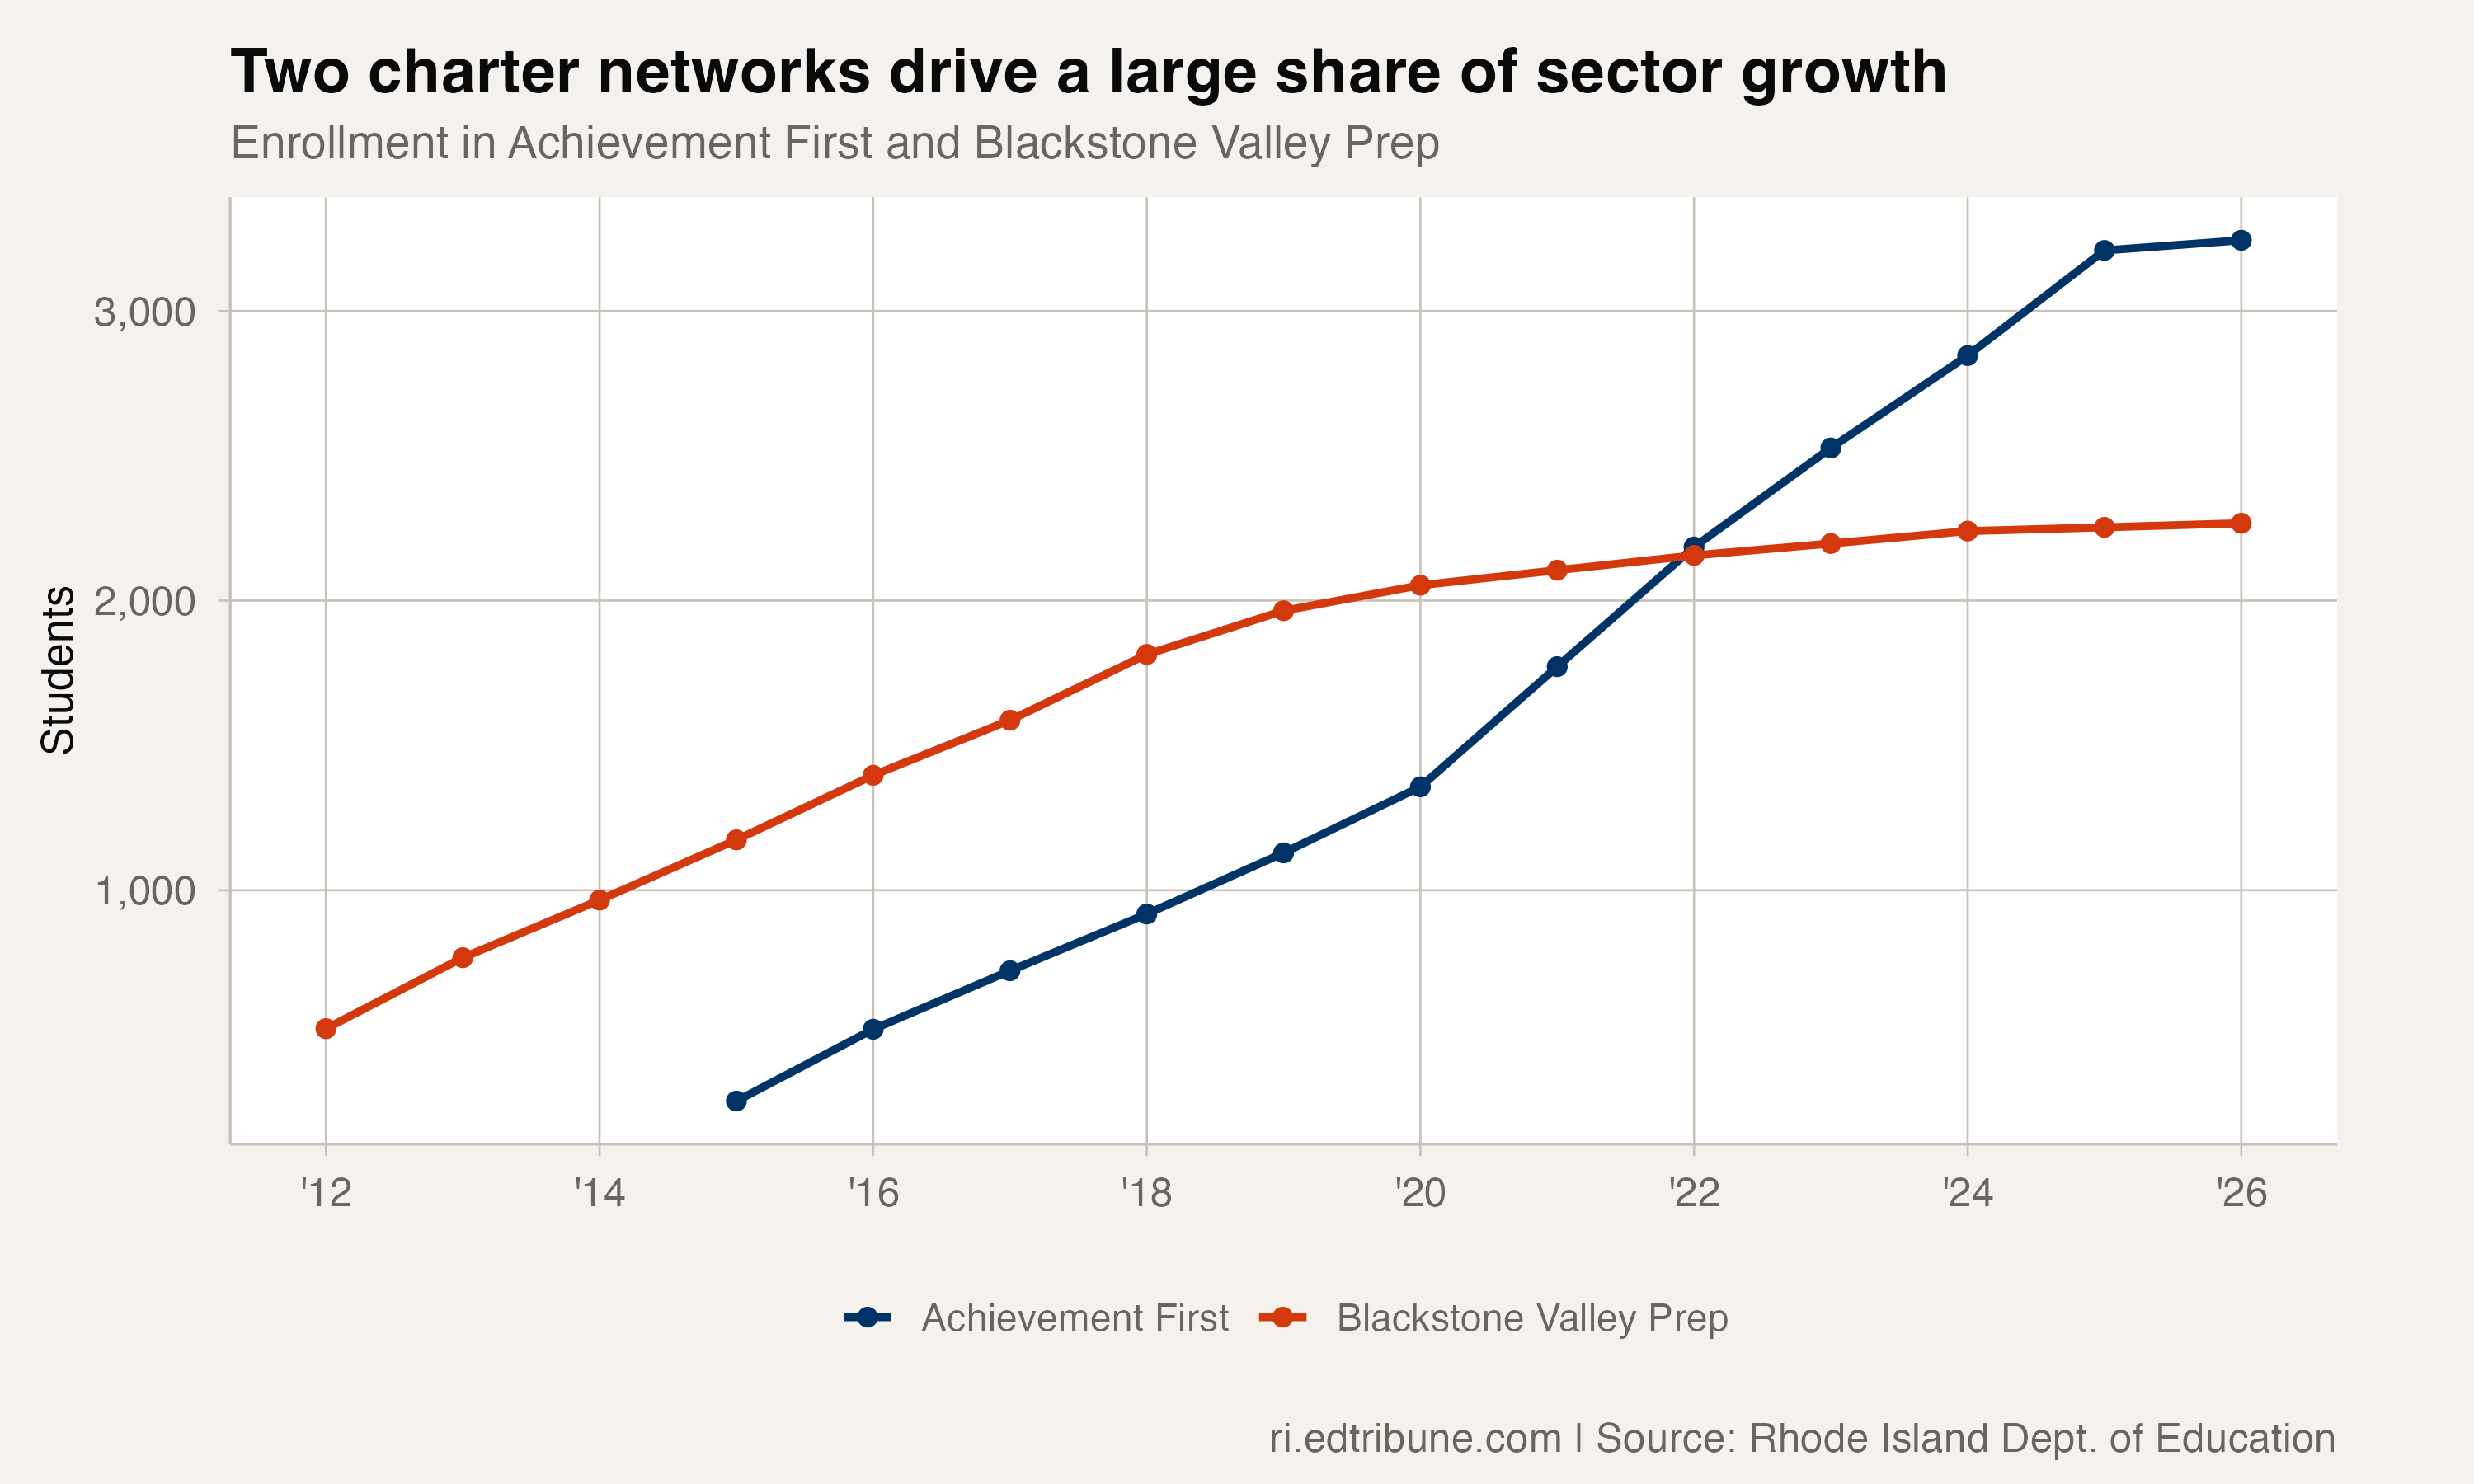
Two charter networks — Achievement First and Blackstone Valley Prep — together enroll 41% of all charter students statewide.
That concentration is striking. Achievement First Rhode Island grew from 272 to 3,244 students since 2014-15 (+1,093%). Blackstone Valley Prep grew from 522 to 2,267 since 2011-12 (+334%). When two operators account for four of every ten charter seats, "sector growth" is really a concentration story. Their decisions on grade span, expansion pace, and seat counts can move the statewide number in ways that smaller charters cannot.
| Metric | Value |
|---|---|
| Charter enrollment, 2010-11 | 2,741 |
| Charter enrollment, 2025-26 | 13,441 |
| Charter share, 2010-11 | 1.9% |
| Charter share, 2025-26 | 10.0% |
| Charter districts, 2010-11 | 12 |
| Charter districts, 2025-26 | 25 |
| Traditional enrollment change since 2010-11 | -20,664 (-14.6%) |
| AF + BVP share of charter enrollment | 41% |
Charter and traditional enrollment moved in opposite directions in most years of this window — a persistent divergence, not a one-off.
Demand outstrips supply — but that does not explain everything
Public reporting has documented a demand-capacity gap in Rhode Island charters, with about 11,000 applications competing for roughly 2,500 available seats in 2025 (NBC 10, Jan. 30, 2025). That is direct evidence that seat supply may be constraining growth even when family demand remains strong.
Rhode Island's charter authorization framework makes expansion a governed process rather than an automatic response to demand (RIDE charter schools). Demand and growth are not the same thing; demand can stay high while growth slows if new seats come online more gradually.
There is still a competing explanation. Charter growth is happening during broader statewide enrollment decline, so sector gains cannot be read as one-for-one transfers from traditional districts. This dataset does not include student origin/destination records, so it cannot show exactly where each incremental charter student came from.
"The birth rate is down nationally, and parents are making different decisions." — Commissioner Angelica Infante-Green, quoted by NBC 10
That context helps explain why both dynamics can be true at once: long-run charter expansion and statewide contraction. Rhode Island's overall enrollment picture has been one of persistent decline — the steepest single-year drop since the pandemicET hit in 2025-26, and none of the six largest districts have recovered to pre-pandemic levels.
The gaps in the data
From these data alone, charter growth cannot be cleanly allocated across:
- transfers from traditional districts,
- shifts from non-public sectors,
- inter-charter reallocation,
- retention and re-entry effects.
The same uncertainty applies to district declines: coexistence with charter growth does not prove one-for-one causality. The file also cannot identify waitlist conversion rates by grade, district of origin by applicant, or seat constraints by operator. Without those fields, it is difficult to distinguish demand saturation from capacity saturation in the 2025-26 deceleration.
Who feels it, and how
Rhode Island state education aid is enrollment-linked, so sector shifts can change district revenue trajectories while legacy costs remain (RIDE state education aid). Districts can lose students faster than they can unwind fixed overhead in buildings, transportation, and school-level administration. That creates stranded costs — and pushes up per-pupil spending for students who remain.
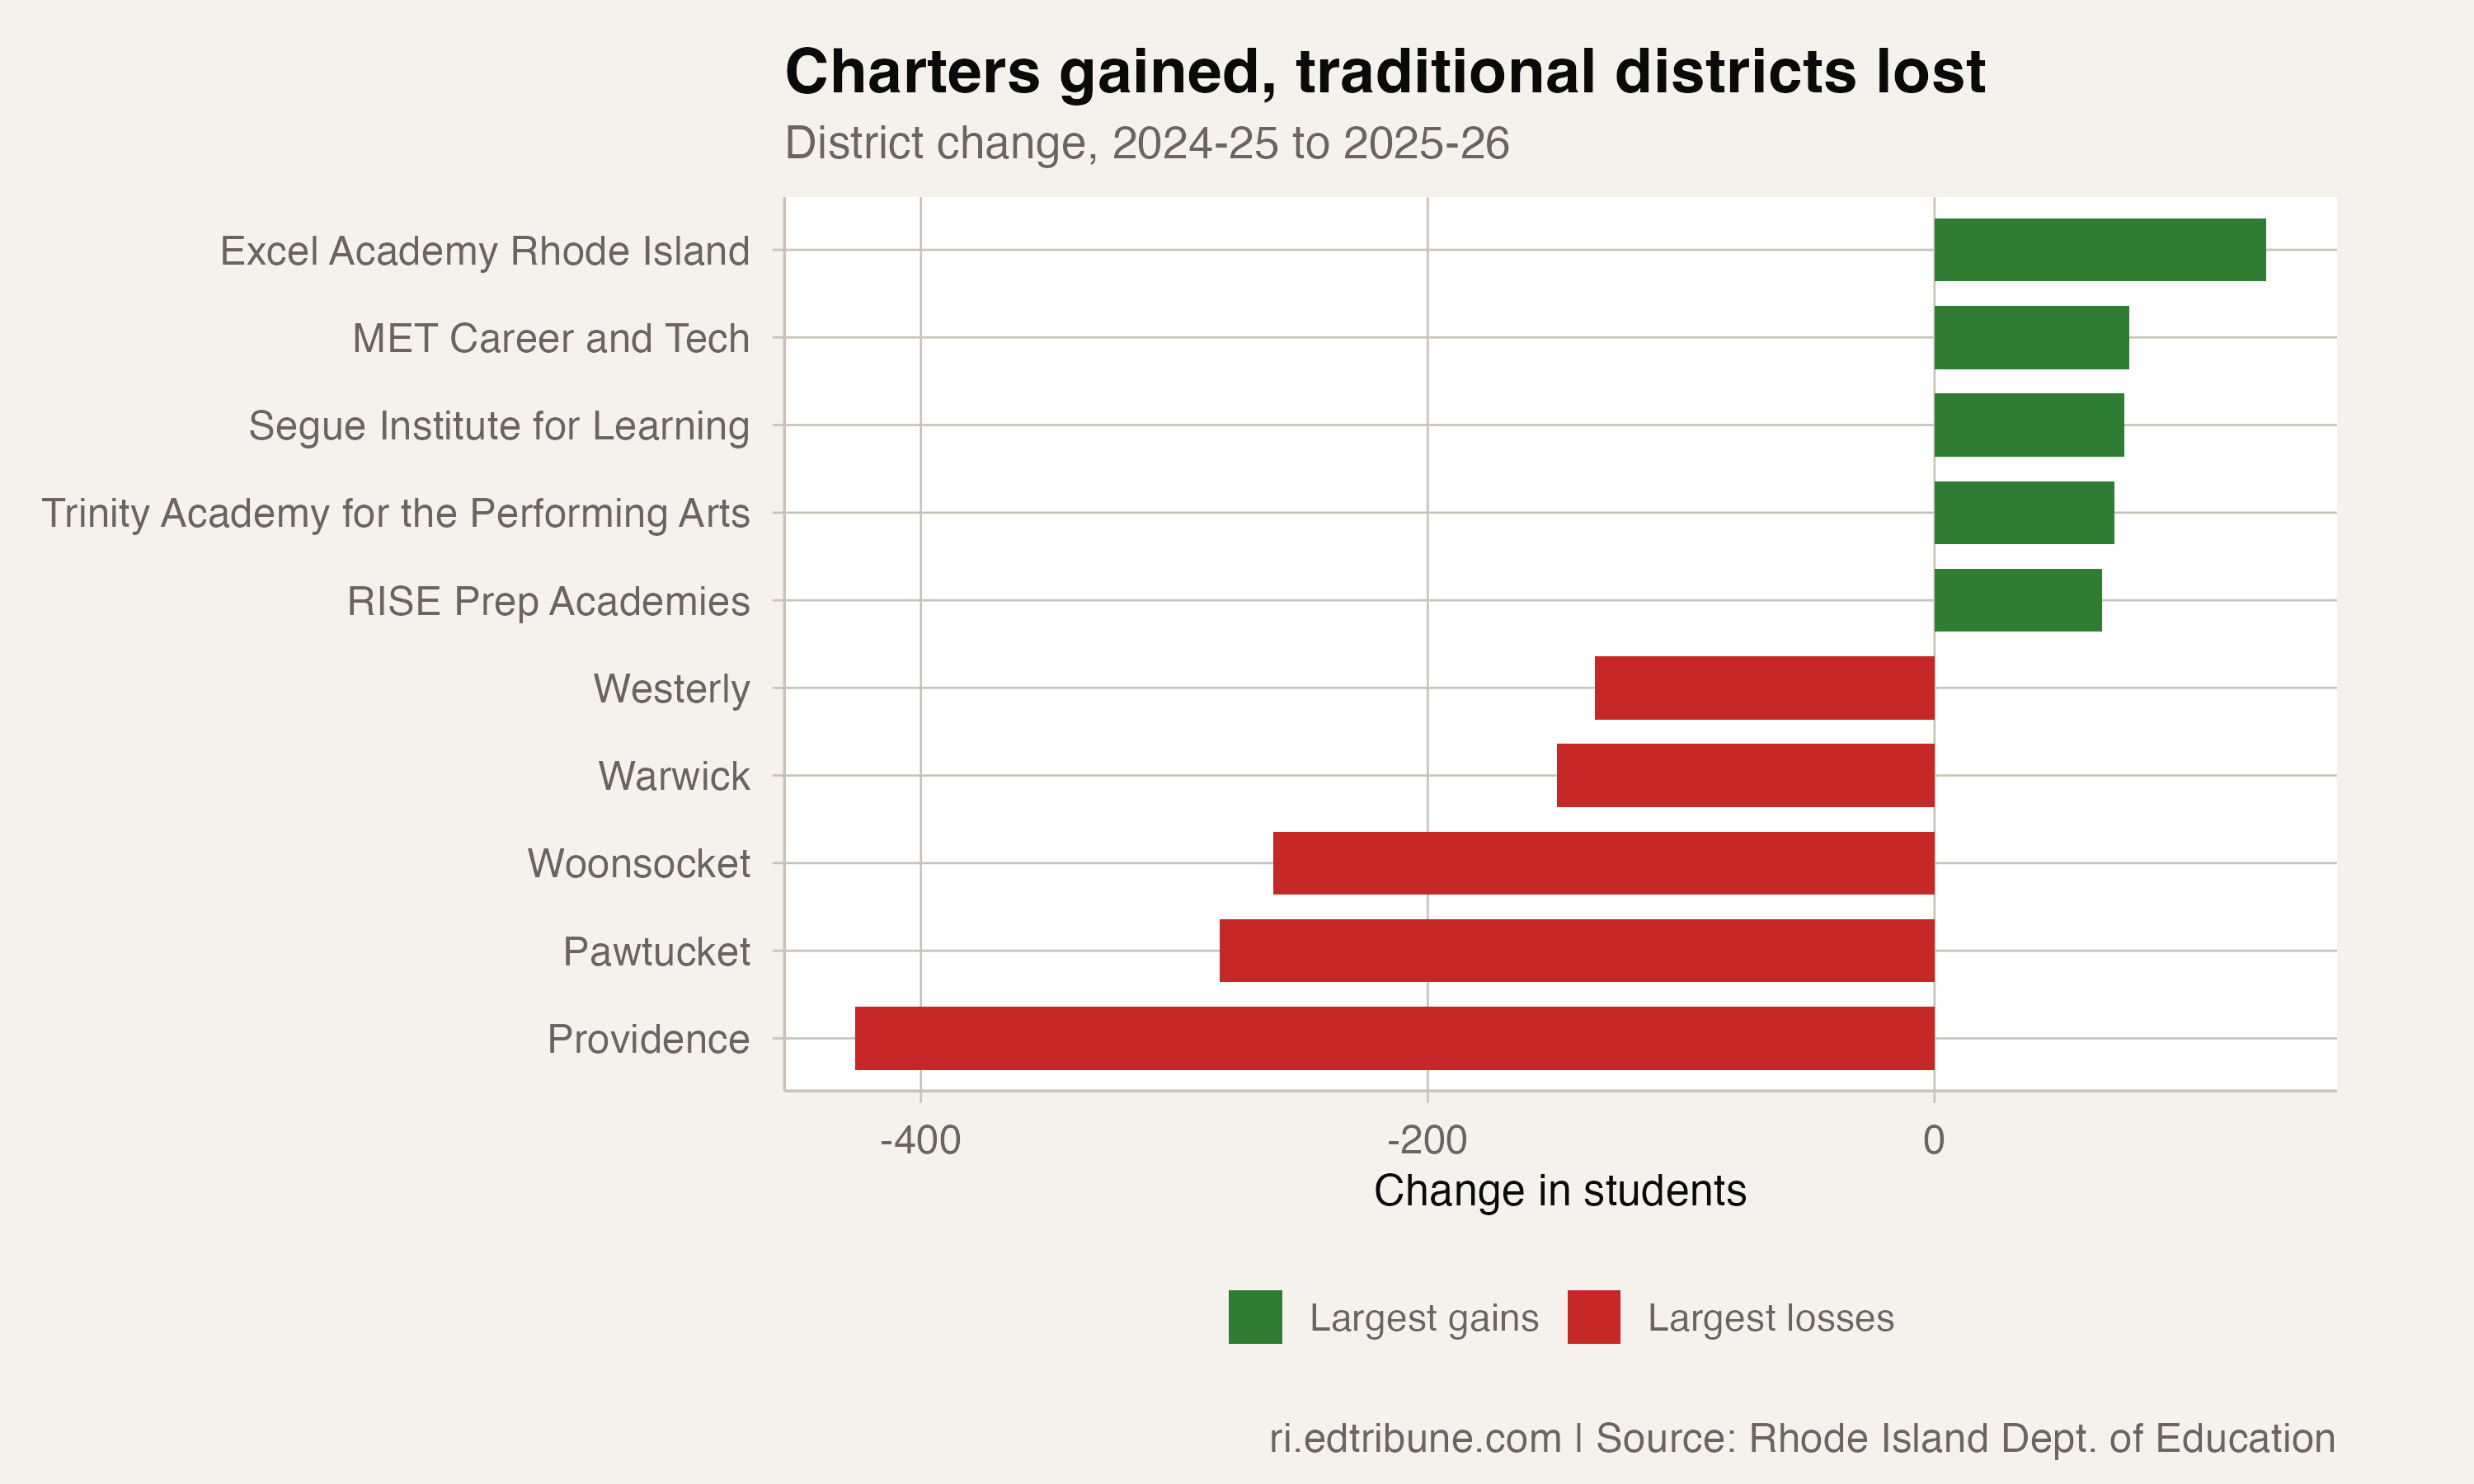
In 2025-26, most top gains were charter and top losses were all traditional, reinforcing the operational split. For district finance teams, the combination of sector shift and system shrinkage creates a two-layer planning problem: movement across sectors and fewer students overall.
What comes next
The open question is whether 2025-26 marks a slower-growth phase for charters or a one-year pause. At +2.8%, the sector added fewer students than in any recent year — but it still added students while traditional districts lost them. For charter operators, the planning challenge is building capacity for demand that may or may not materialize at the same rate. For district leaders, the challenge is adjusting fixed footprints without destabilizing services for the students who are still there.
At 10.0% share, charters are no longer a side current in Rhode Island enrollment. They are one of the main forces shaping district staffing plans, facility decisions, and budget assumptions. The next few years will show whether this threshold was a milestone on the way to something larger, or a ceiling.
Detailed code that reproduces the analysis and figures in this article is available exclusively to EdTribune subscribers.
Discussion
Sign in to join the discussion.
Loading comments...