Correction (July 21, 2026): The statewide enrollment figures and ranking were accurate, but the earlier article presented unsupported stabilization, district-type, fiscal, operational, causal, and predictive interpretations as though they followed from the enrollment file. Its claim ledger also contained circular and accidental evidence. This version removes those claims, adds a matched-district breadth test, and rebuilds every chart and ledger entry from the state's published enrollment data.
In this series: Rhode Island 2025-26 Enrollment.
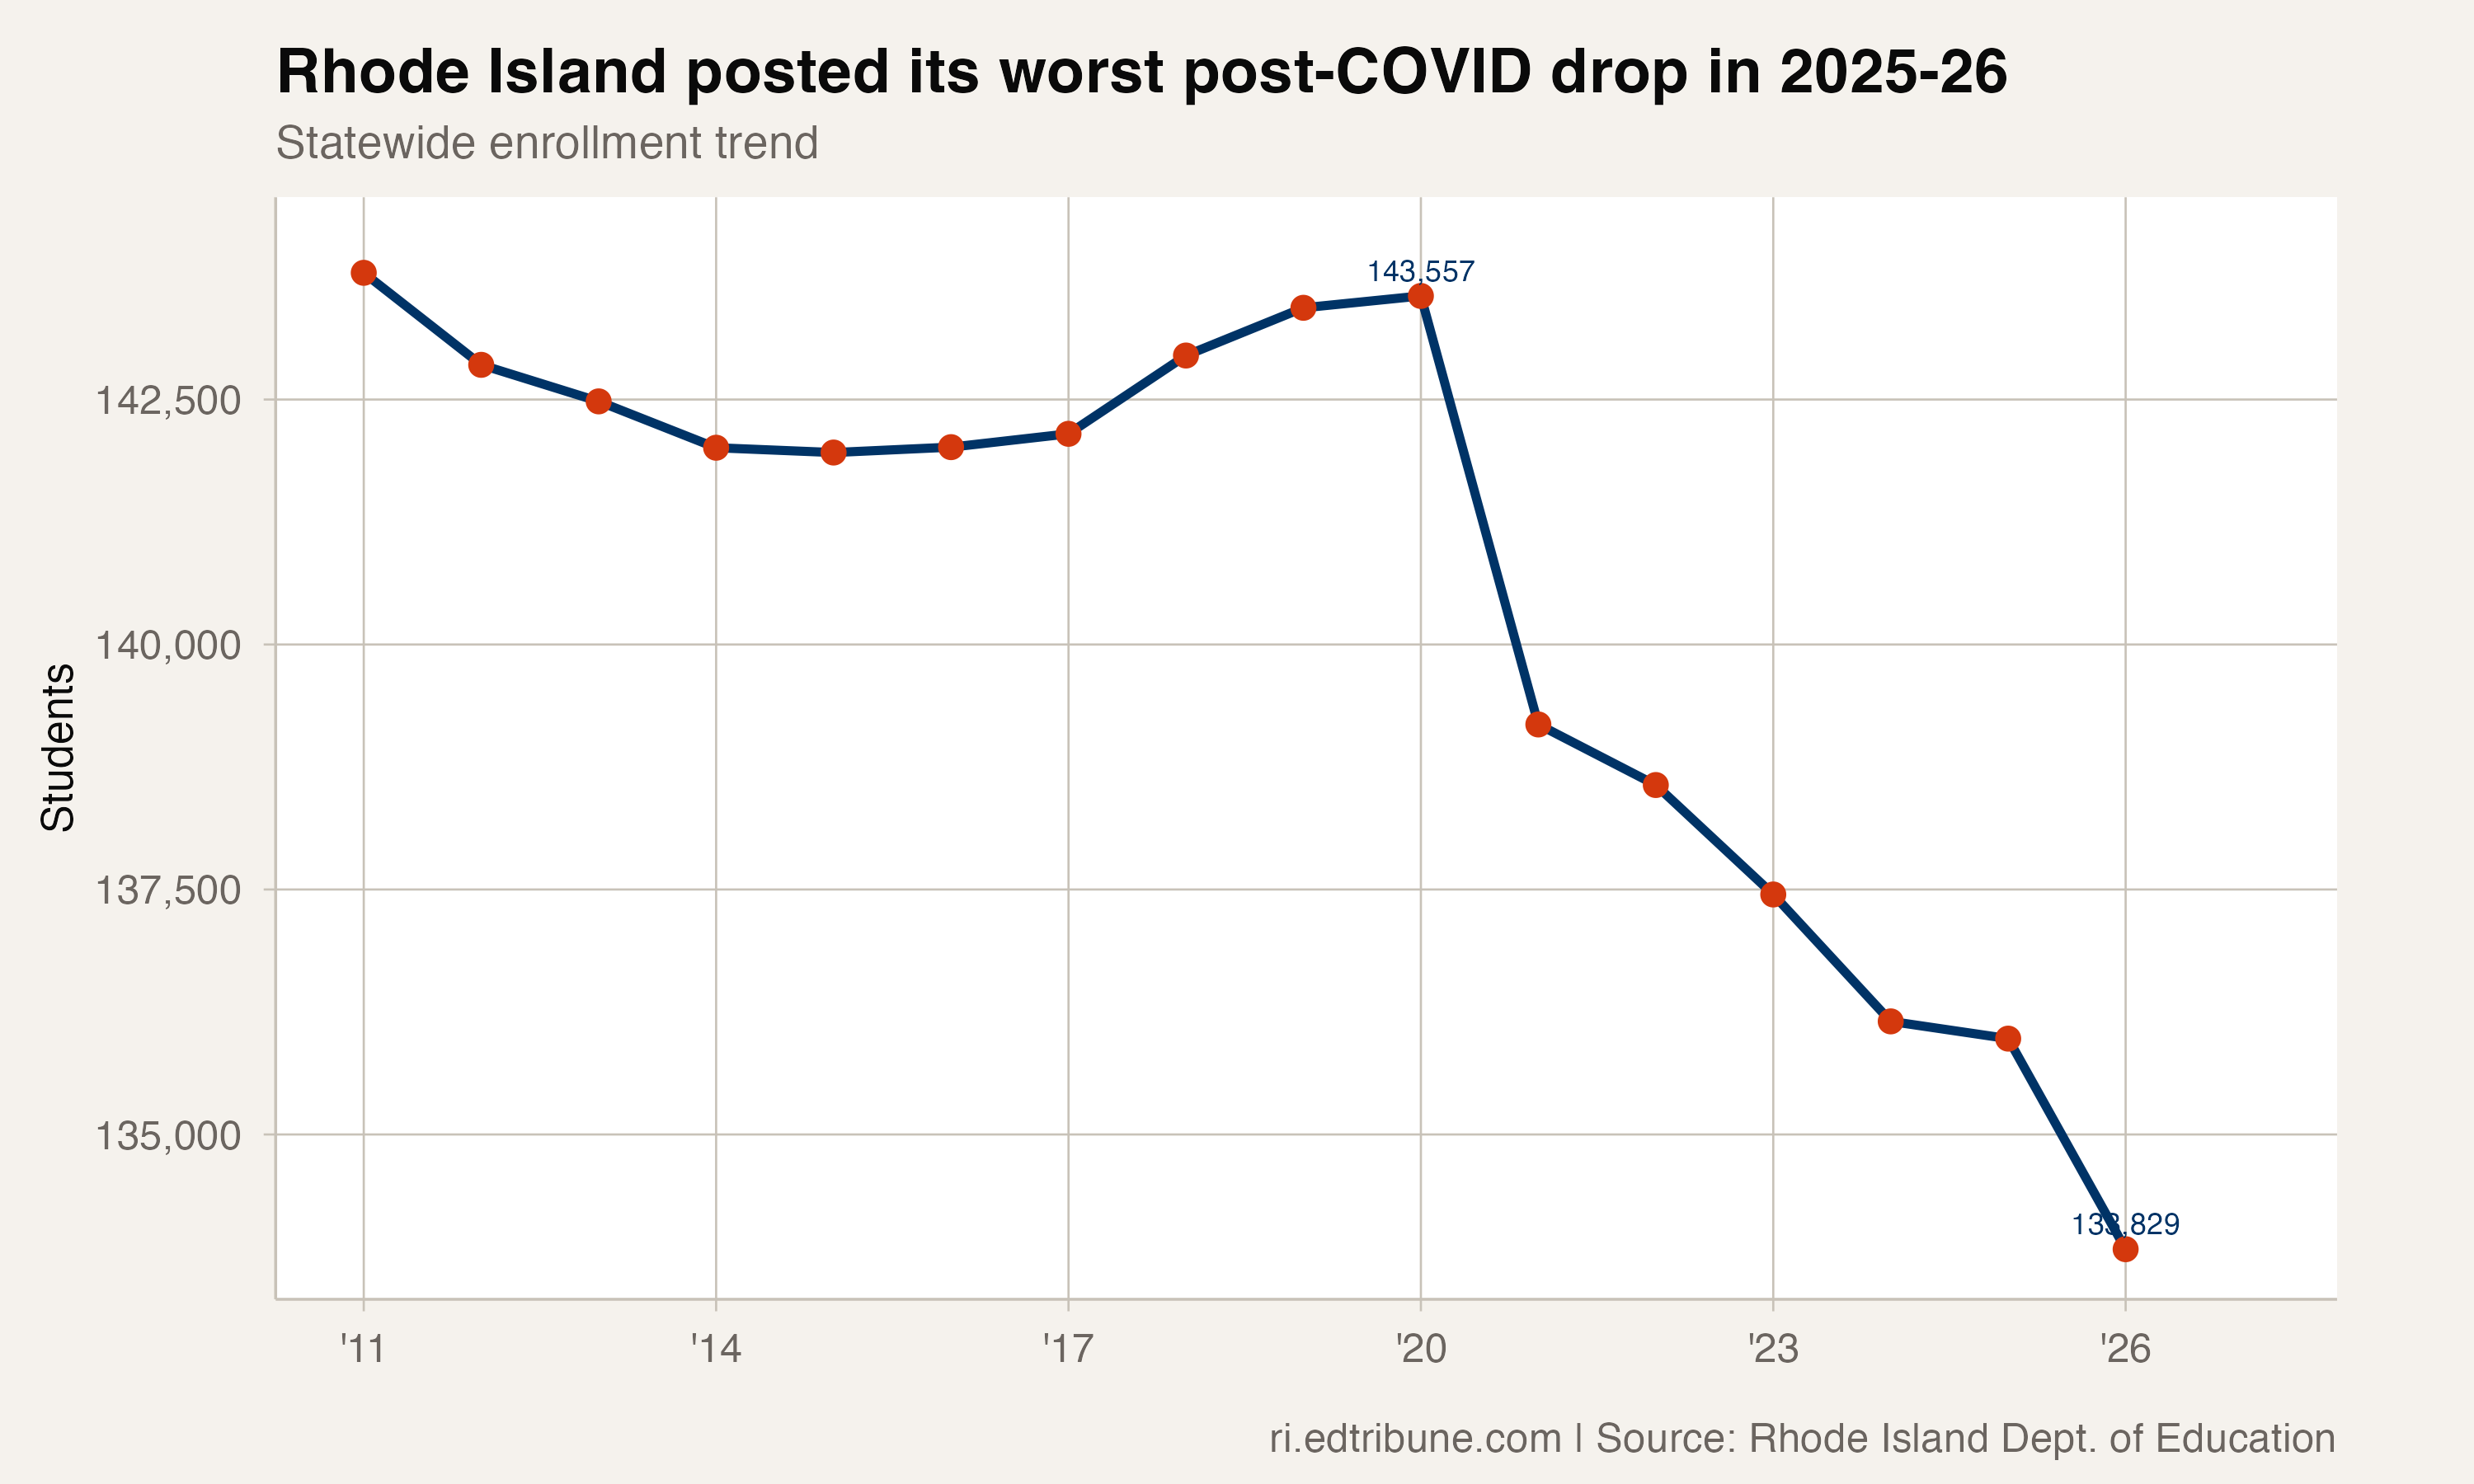
Rhode Island public-school enrollment fell to 133,829 in 2025-26. That was a decline of 2,149 students, or 1.58%, from the prior year.
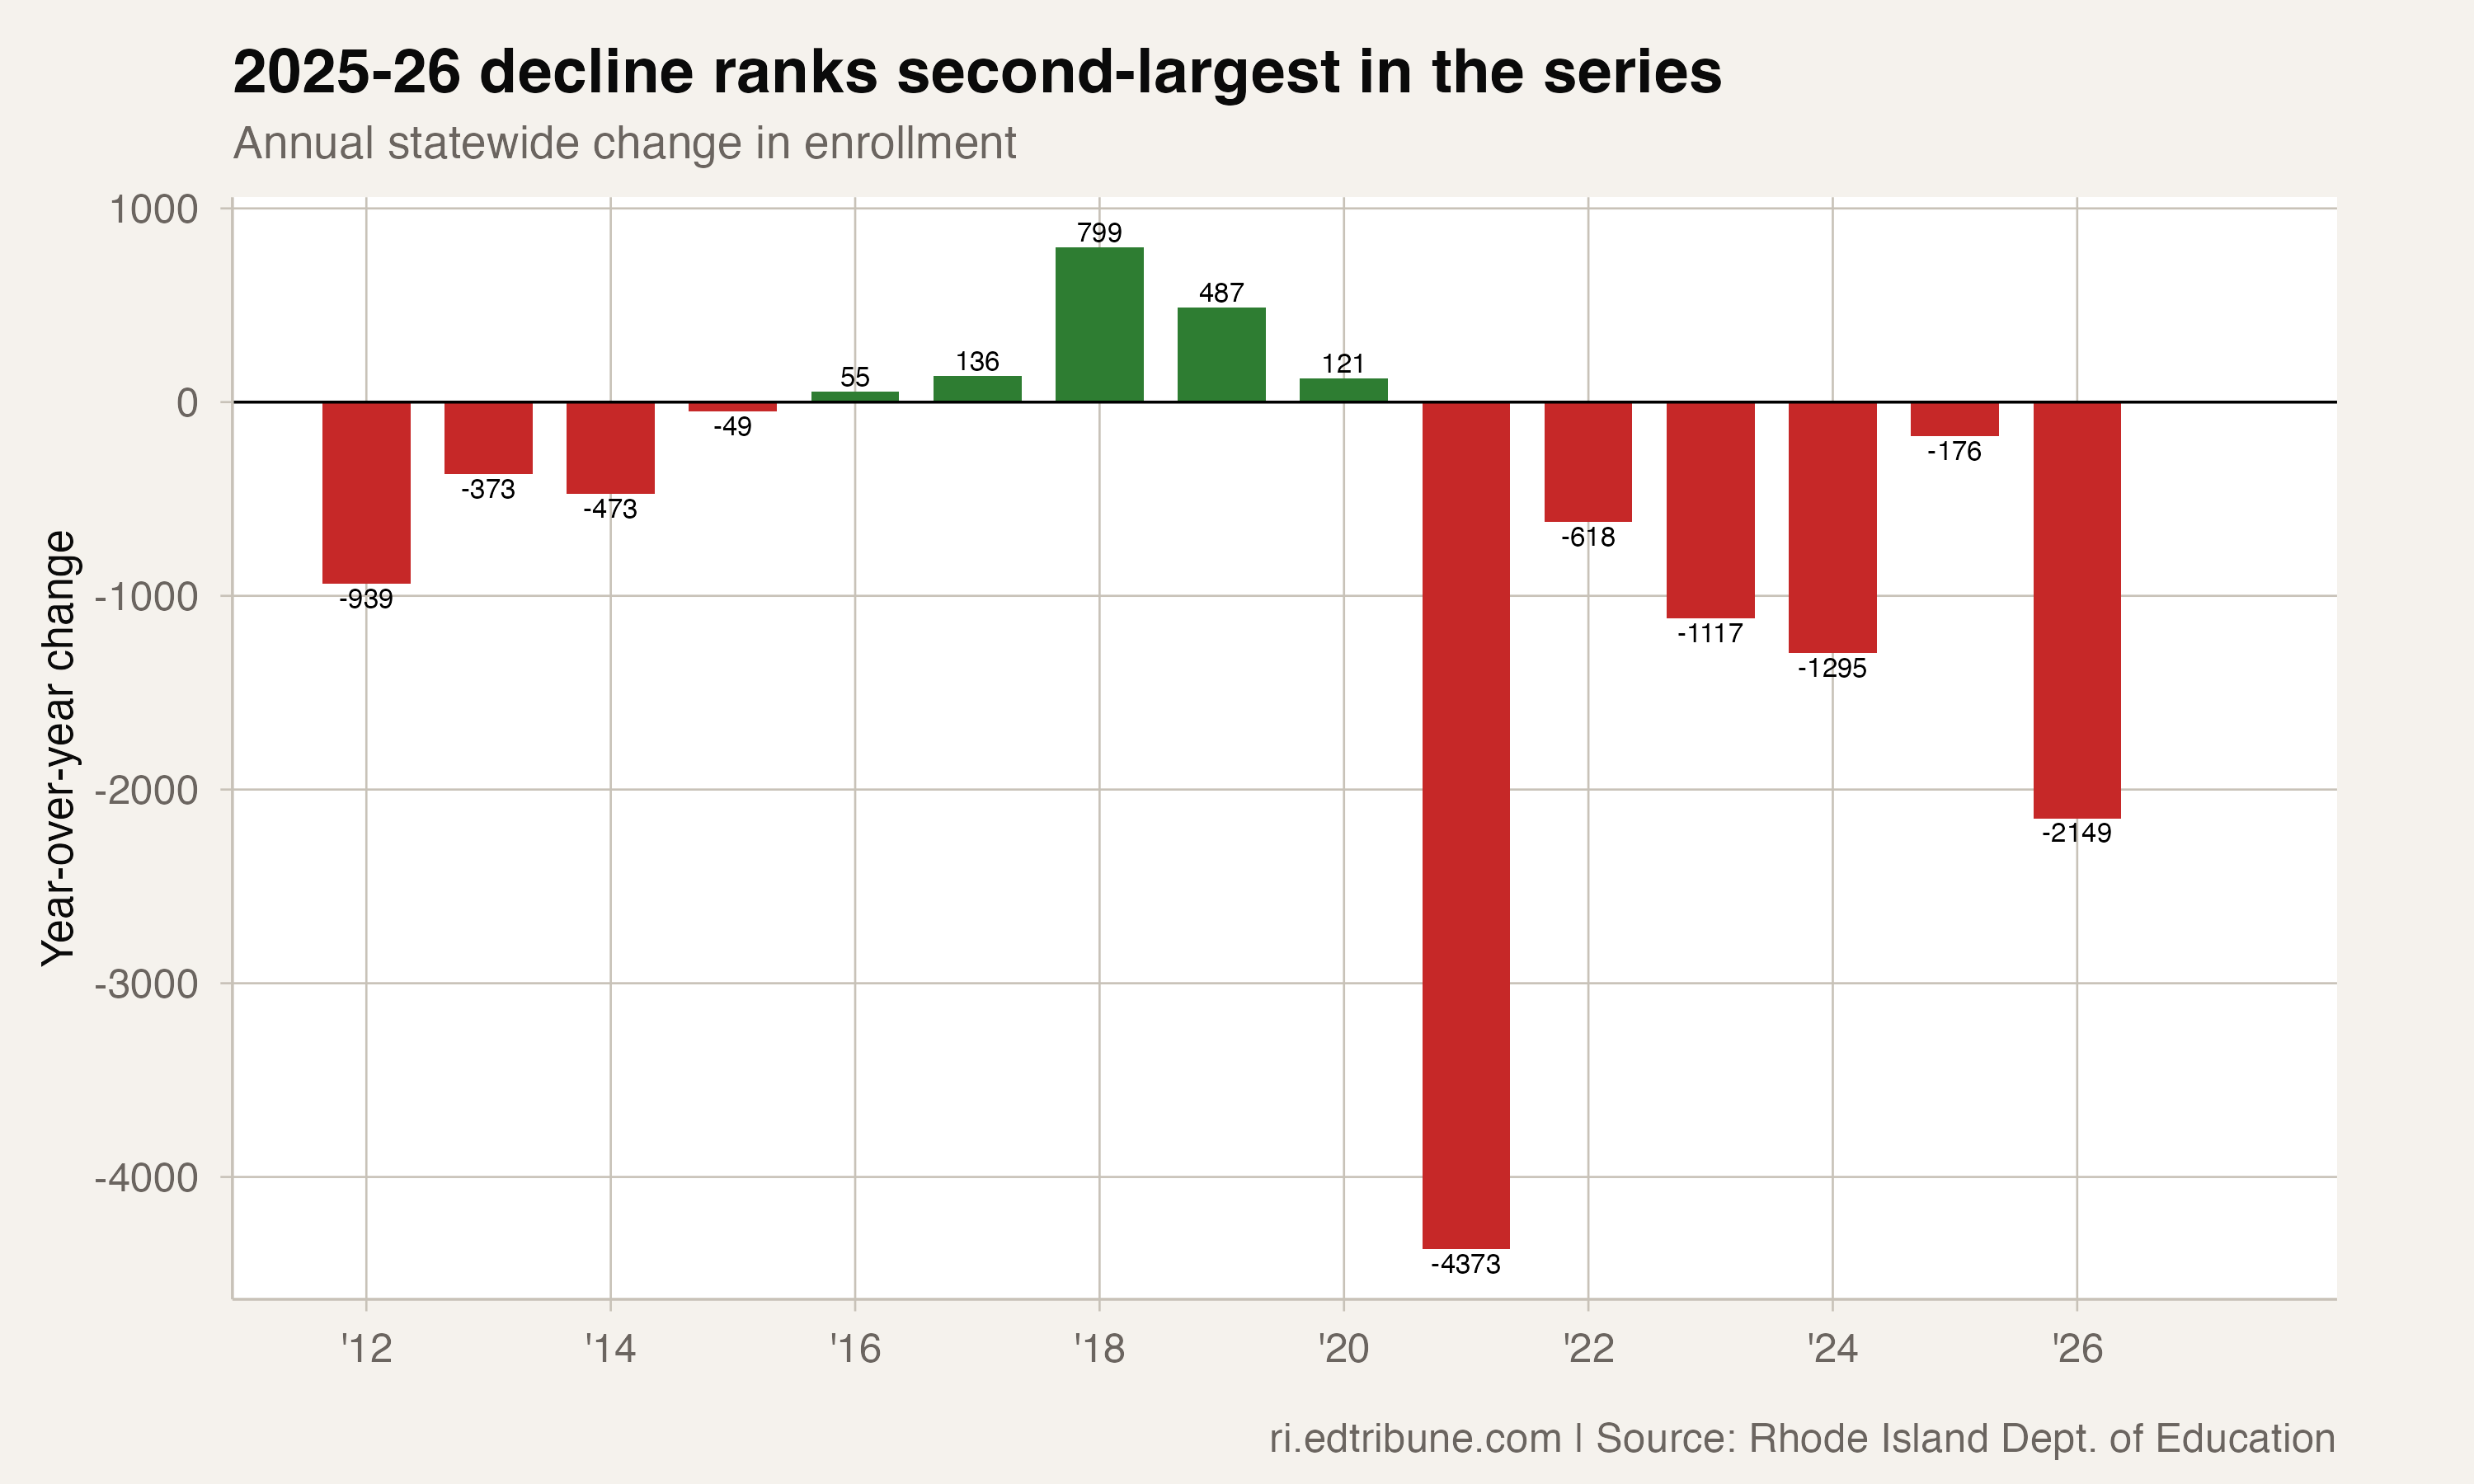
The preceding annual change was much smaller: enrollment fell by 176 students in 2024-25. The new decline ranked second among the 15 annual transitions in the package panel, which runs from 2011 through 2026. The only larger loss was 4,373 students in 2020-21.
Six consecutive statewide declines
Statewide enrollment was 143,557 in 2019-20, an increase of 121 students or 0.08% from the previous year. It then fell in each of the next six annual transitions.
From 2019-20 to 2025-26, the state row declined by 9,728 students, or 6.8%.
| Year | State enrollment | Annual change | Annual % change |
|---|---|---|---|
| 2019-20 | 143,557 | +121 | +0.08% |
| 2020-21 | 139,184 | -4,373 | -3.05% |
| 2021-22 | 138,566 | -618 | -0.44% |
| 2022-23 | 137,449 | -1,117 | -0.81% |
| 2023-24 | 136,154 | -1,295 | -0.94% |
| 2024-25 | 135,978 | -176 | -0.13% |
| 2025-26 | 133,829 | -2,149 | -1.58% |
The sequence establishes a six-transition decline and the size of each annual change. It does not establish that the smaller 2024-25 loss was a floor, a pause, or evidence of stabilization.
Most matched district rows declined, but not all
The district comparison contains 64 rows with total-enrollment values in both 2024-25 and 2025-26. Of those, 41 decreased, 21 increased, and two were unchanged.
Providence had the largest absolute decline in the matched table, from 20,250 to 19,824 students, a loss of 426. Pawtucket fell from 7,816 to 7,534, a loss of 282. Woonsocket fell from 5,541 to 5,280, a loss of 261.
Together, those three declines totaled 969 students, equal to 45.1% of the statewide loss.
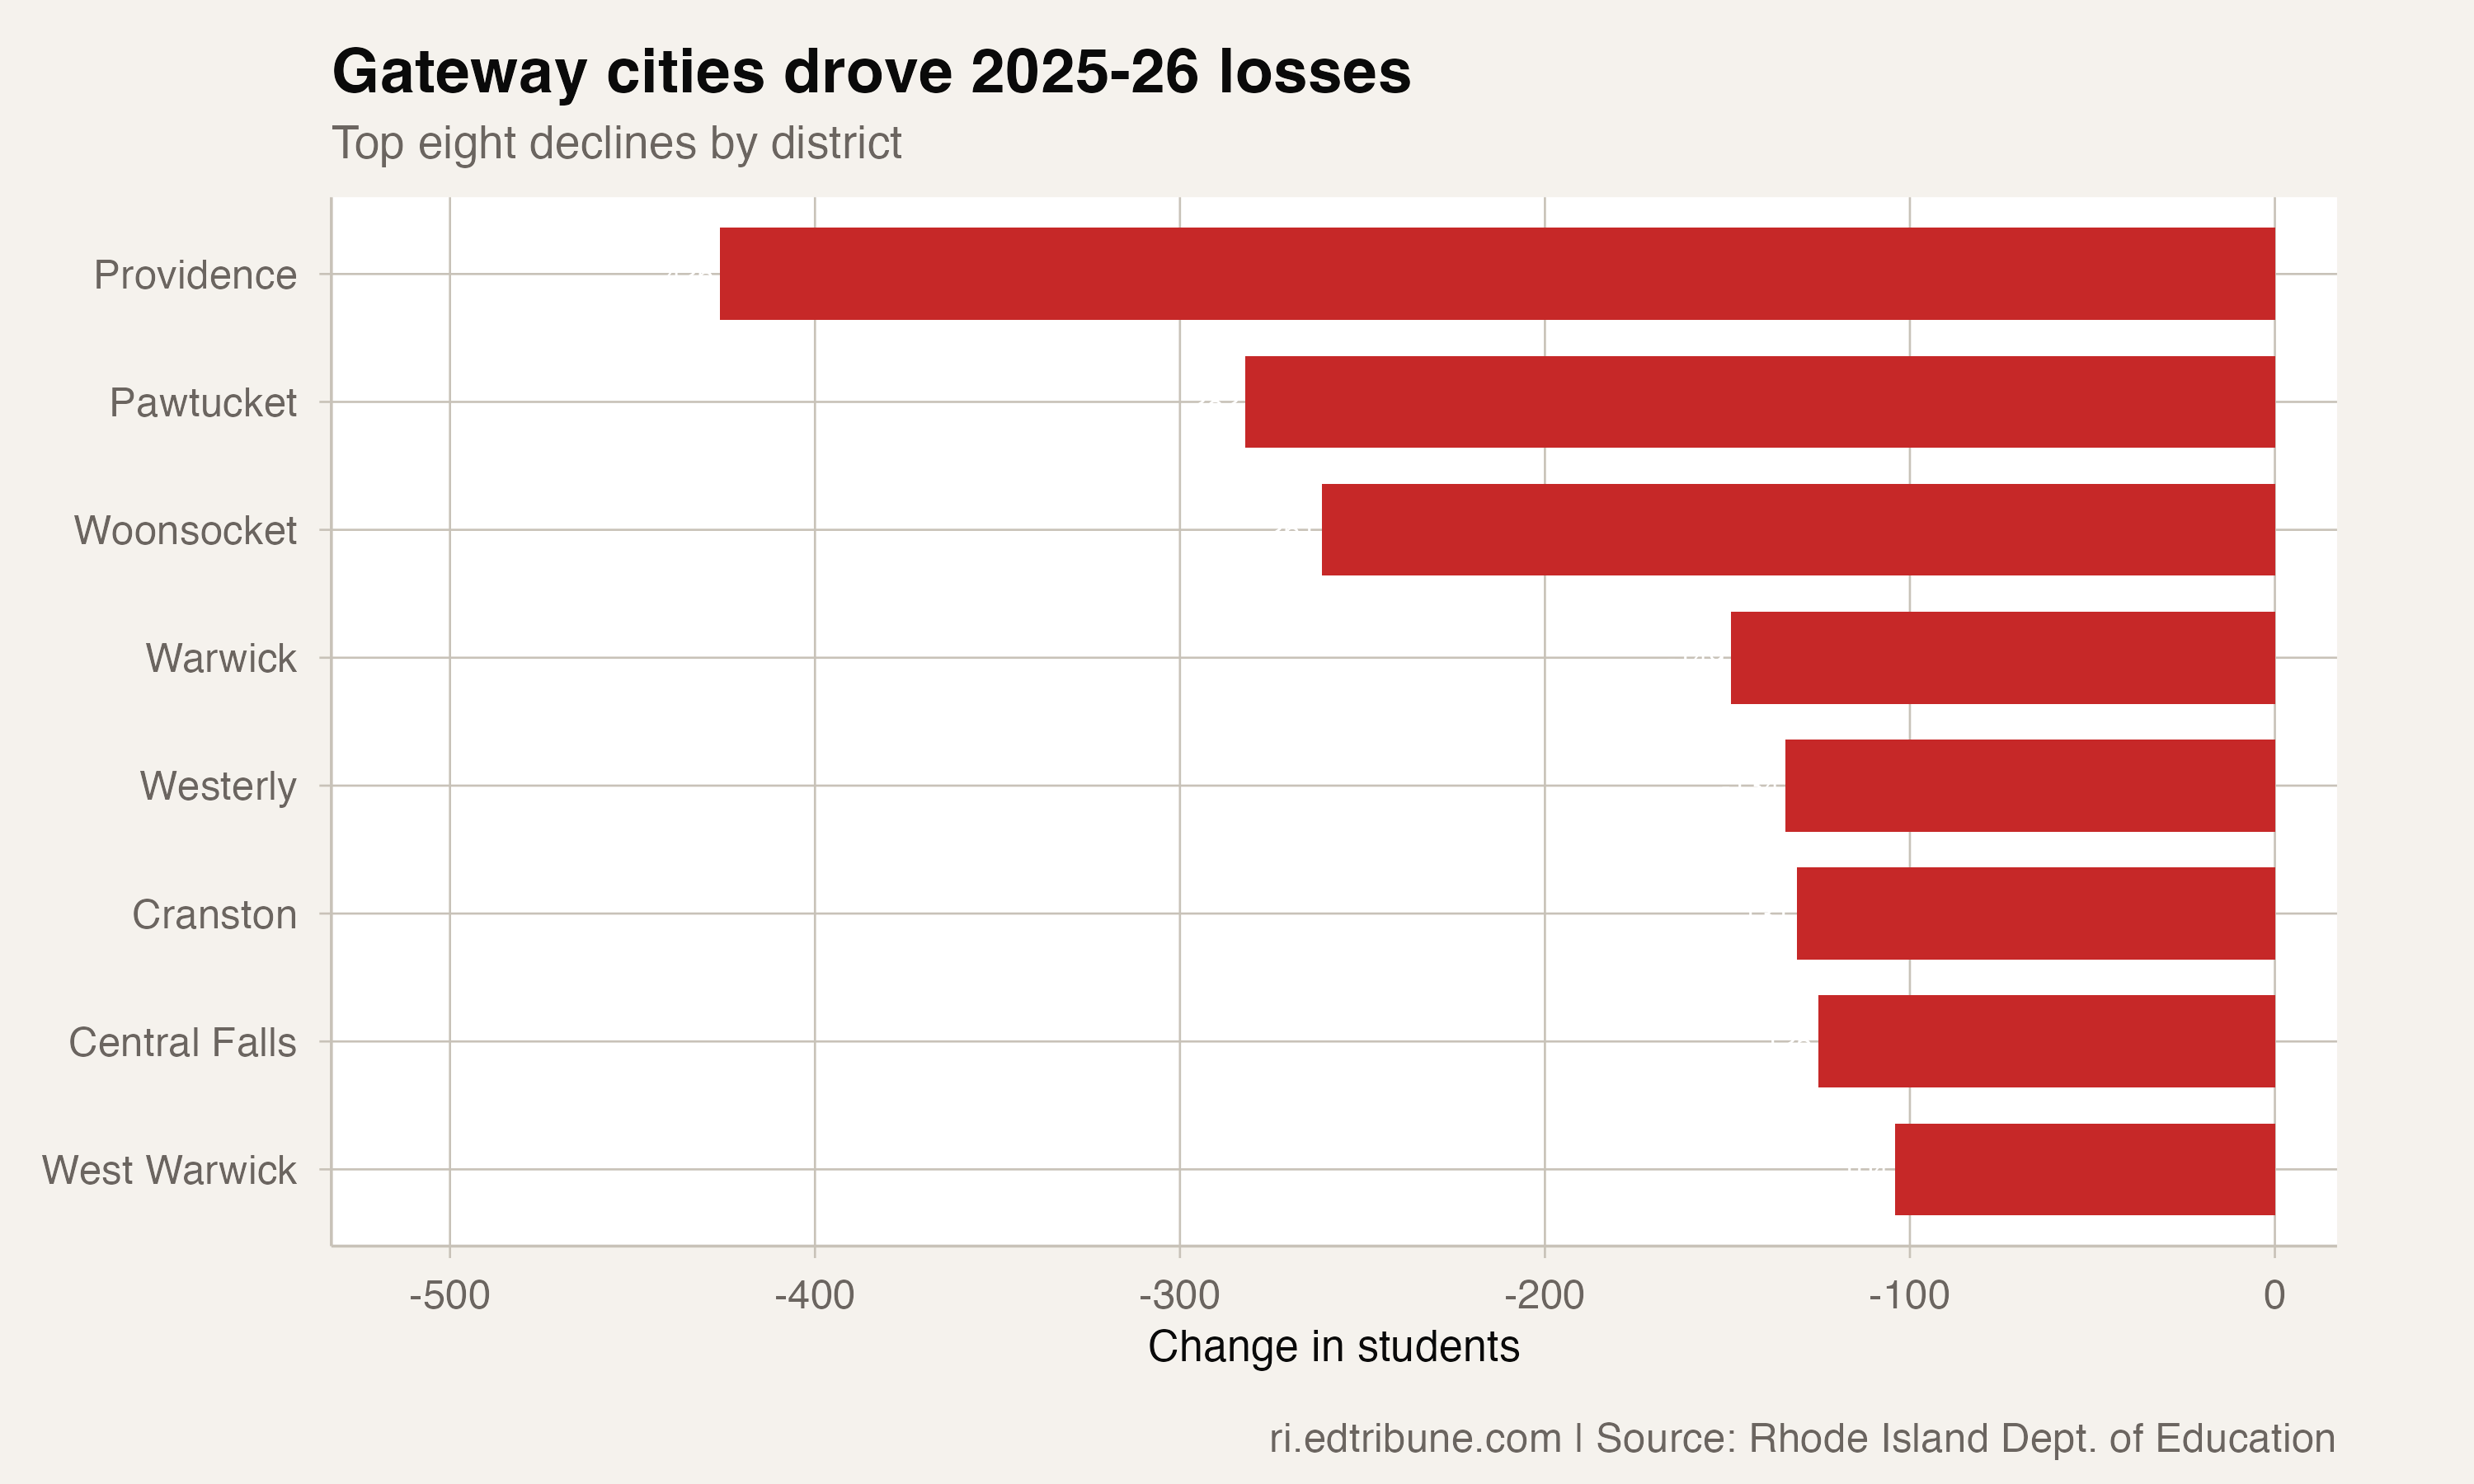
The chart reports the eight largest declines in the matched district table. It does not classify those districts by policy category or establish that their enrollment levels were historical lows.
What the file does not answer
The enrollment package reports state and district counts. It does not track individual students between public districts, charter schools, private schools, home schools, or states. It also does not identify which mechanisms produced the net change.
For the same reason, this analysis cannot infer future staffing, facilities, transportation, or funding decisions from the enrollment counts alone. Those questions require additional records and district-specific context.
The bounded finding is still clear: 2025-26 produced a 2,149-student statewide loss, the second-largest of 15 annual changes in the package panel, and 41 of 64 matched district rows declined.
Detailed code that reproduces the analysis and figures in this article is available exclusively to EdTribune subscribers.
Discussion
Sign in to join the discussion.
Loading comments...