In this series: Rhode Island 2025-26 Enrollment.
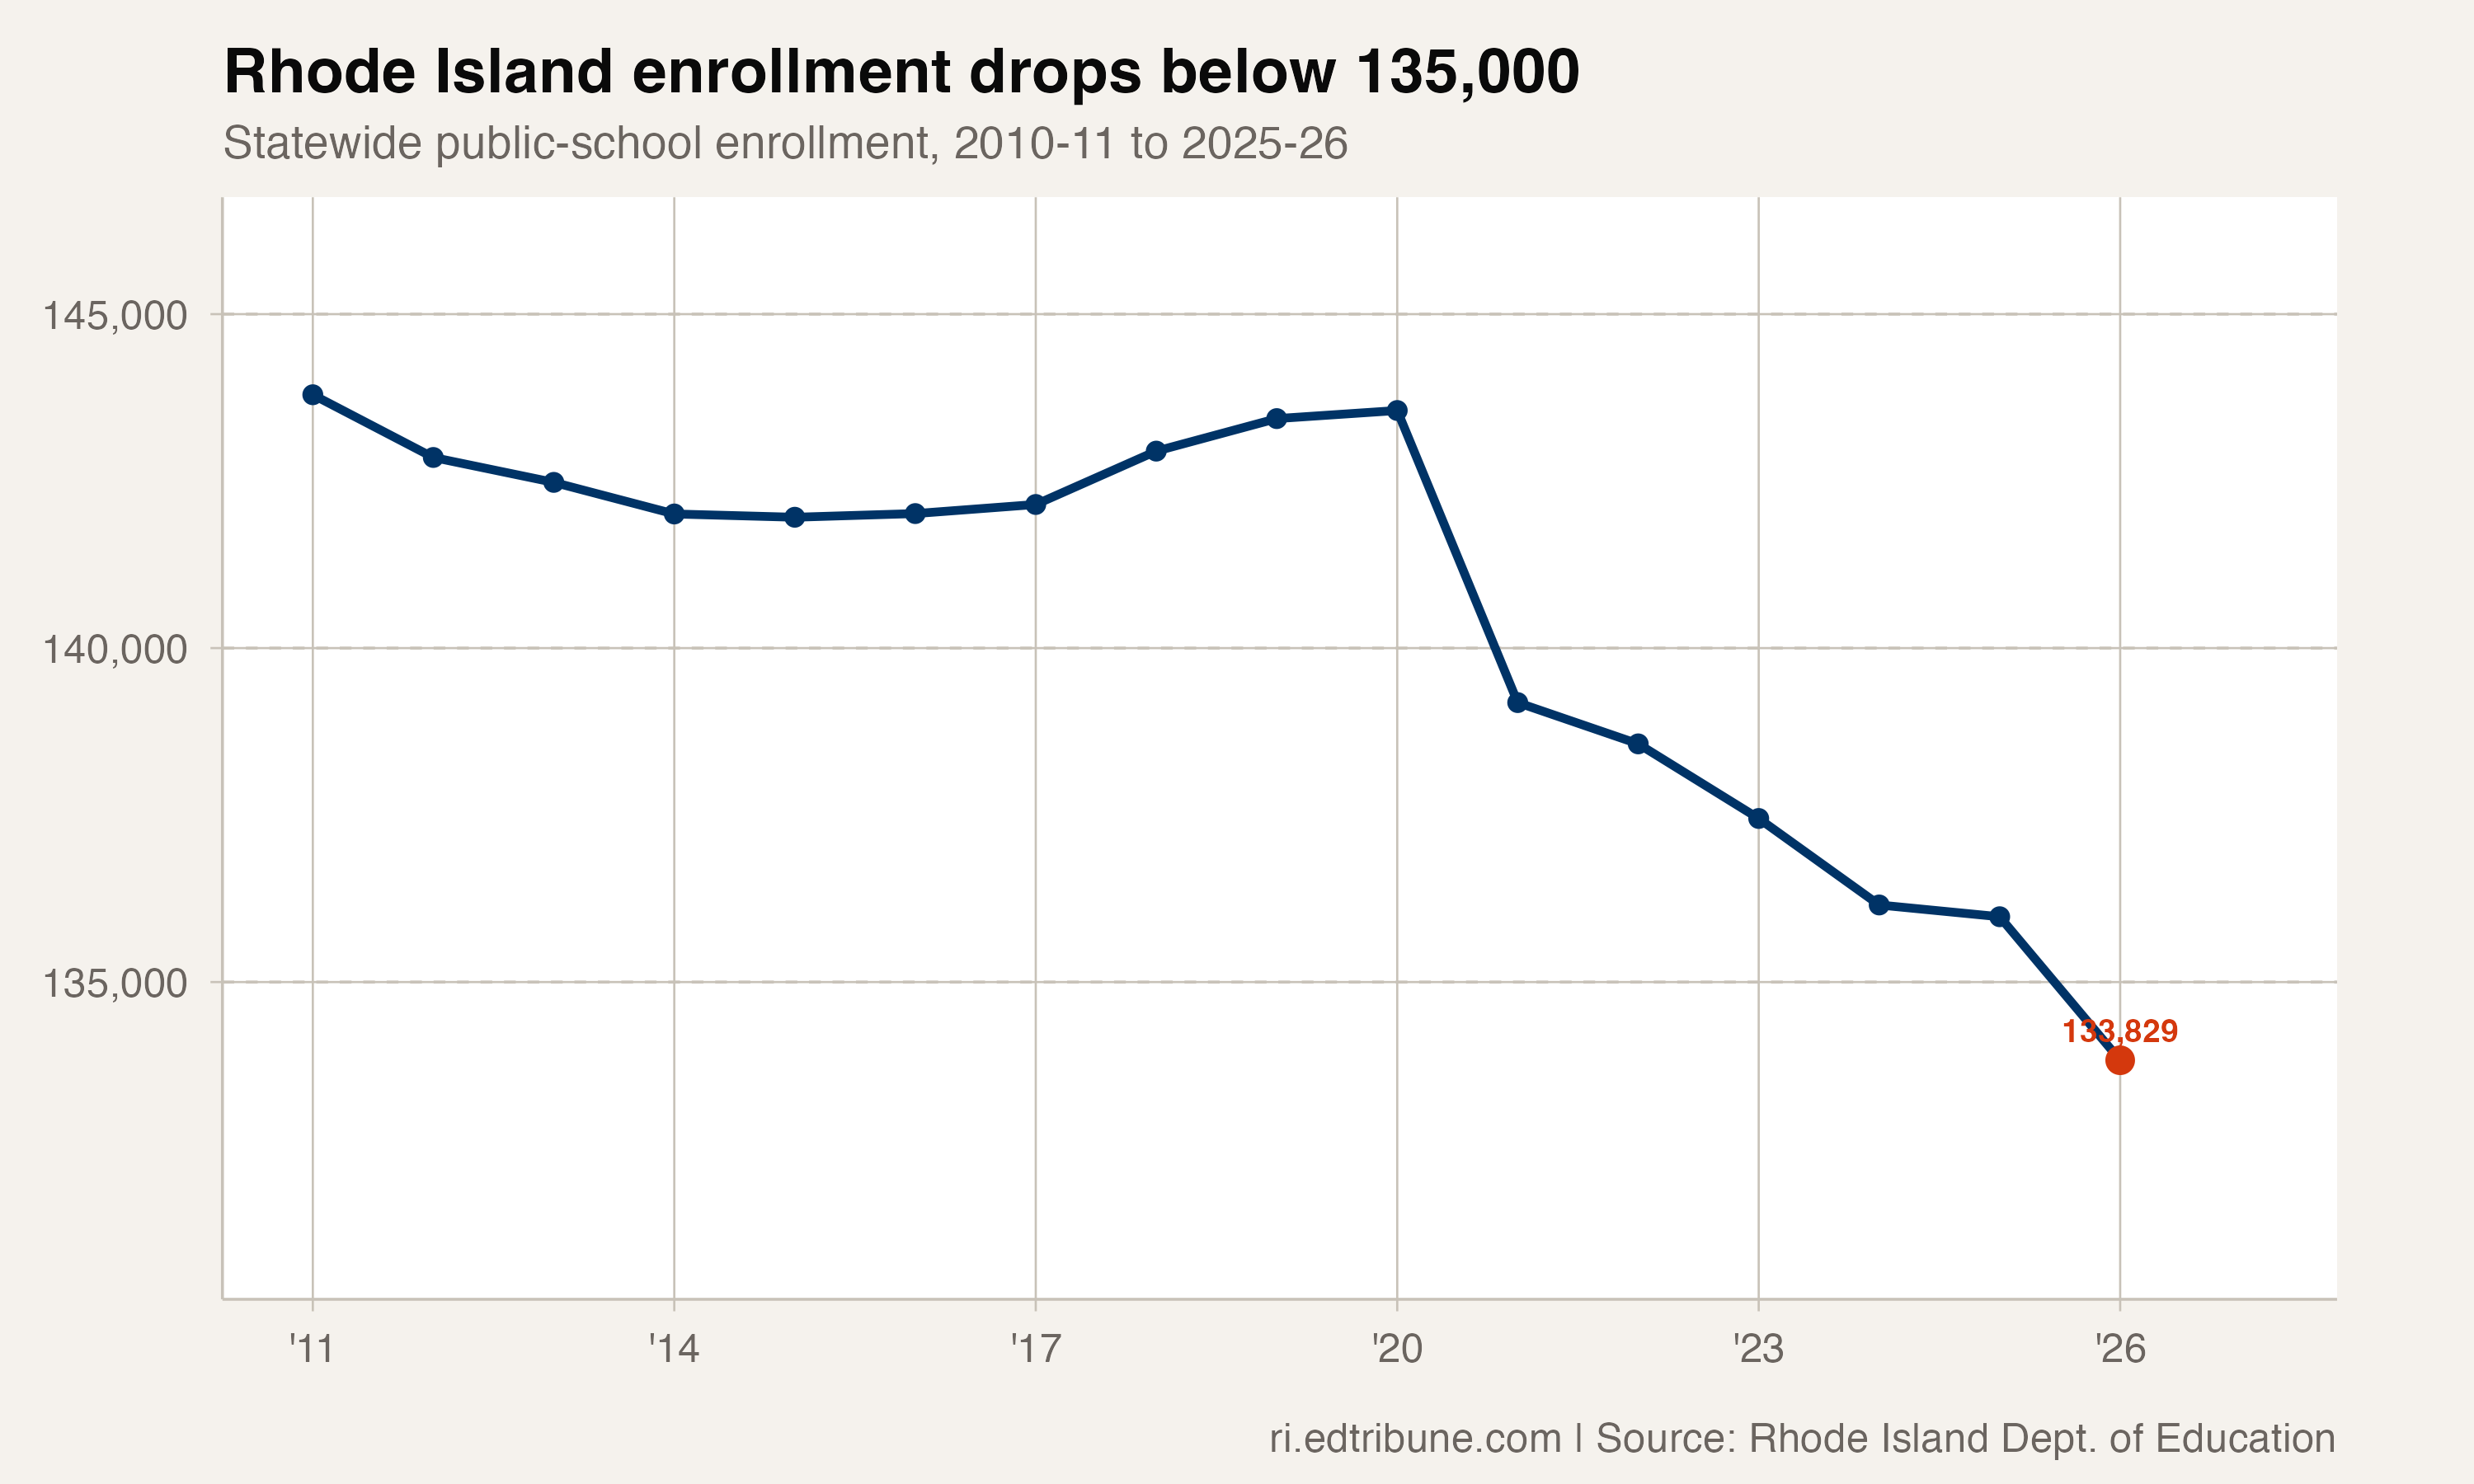
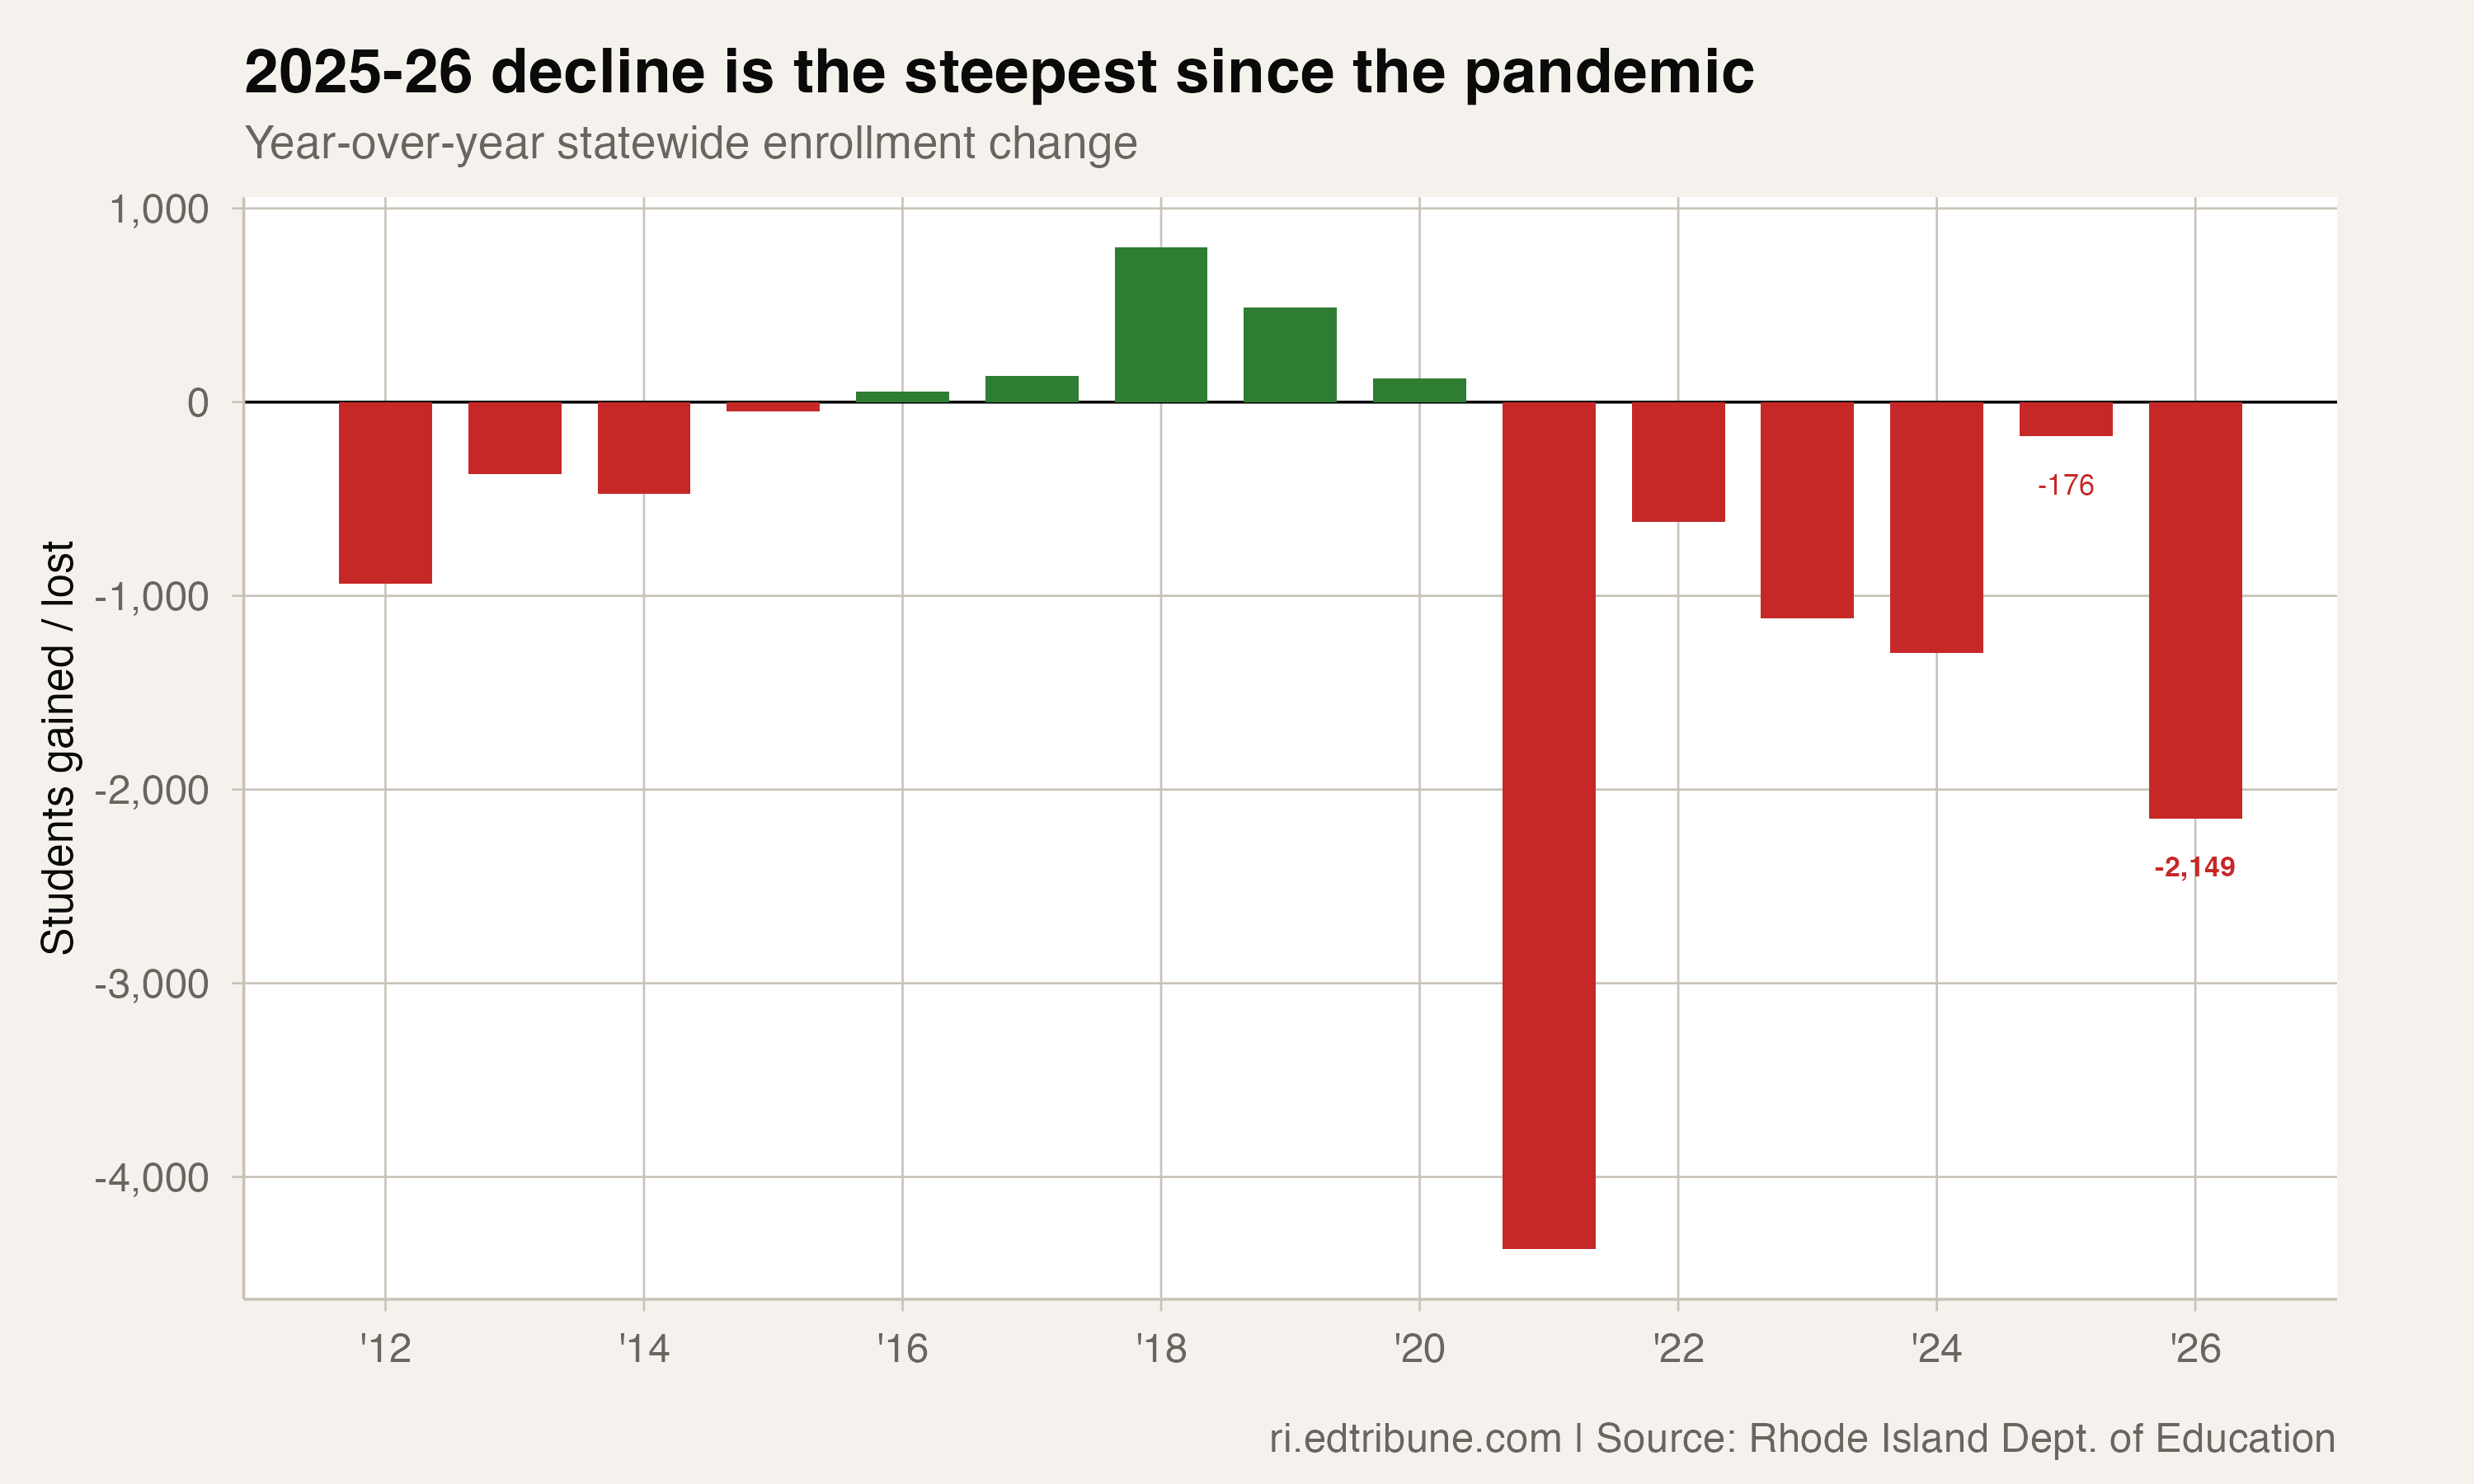
Last year, Rhode Island's public schools lost just 176 students. Superintendents could squint at the number and see a floor — the bottom of a post-pandemic slide, the point where things level off. Then 2025-26 arrived: 2,149 more students gone, enrollment down to 133,829, and the statewide total below 135,000 for the first time in this panel. The floor was a mirage.
That whiplash — from near-zero loss to the steepest decline since the pandemic — is the real story here. A round-number milestone makes a headline, but what matters for every district budget office in the state is the return of downward momentum in a system that had briefly looked stable.
Six years down, and accelerating
Rhode Island's enrollment trajectory now has a clear shape. The state started this series at 143,793 in 2010-11, recovered briefly into the pre-pandemic period, then moved into a six-year uninterrupted decline from 2020-21 through 2025-26.
The annual losses in that run tell their own story: -4,373, -618, -1,117, -1,295, -176, then -2,149. Cumulatively, enrollment fell by 9,728 students from 2019-20 to 2025-26 (-6.8%). A single bad year can be managed with temporary fixes. Six consecutive years of losses usually cannot — districts are making decisions for a permanently smaller system, not waiting for a rebound that keeps not arriving.
133,829 students — down 9,728 from 2019-20, a 6.8% cumulative loss across six years of unbroken decline.
| Metric | Value |
|---|---|
| Enrollment, 2025-26 | 133,829 |
| Annual change, 2025-26 | -2,149 |
| Annual %, 2025-26 | -1.58% |
| Annual change, 2024-25 | -176 |
| Cumulative change since 2019-20 | -9,728 |
| Cumulative % since 2019-20 | -6.8% |
| Consecutive annual declines | 6 |
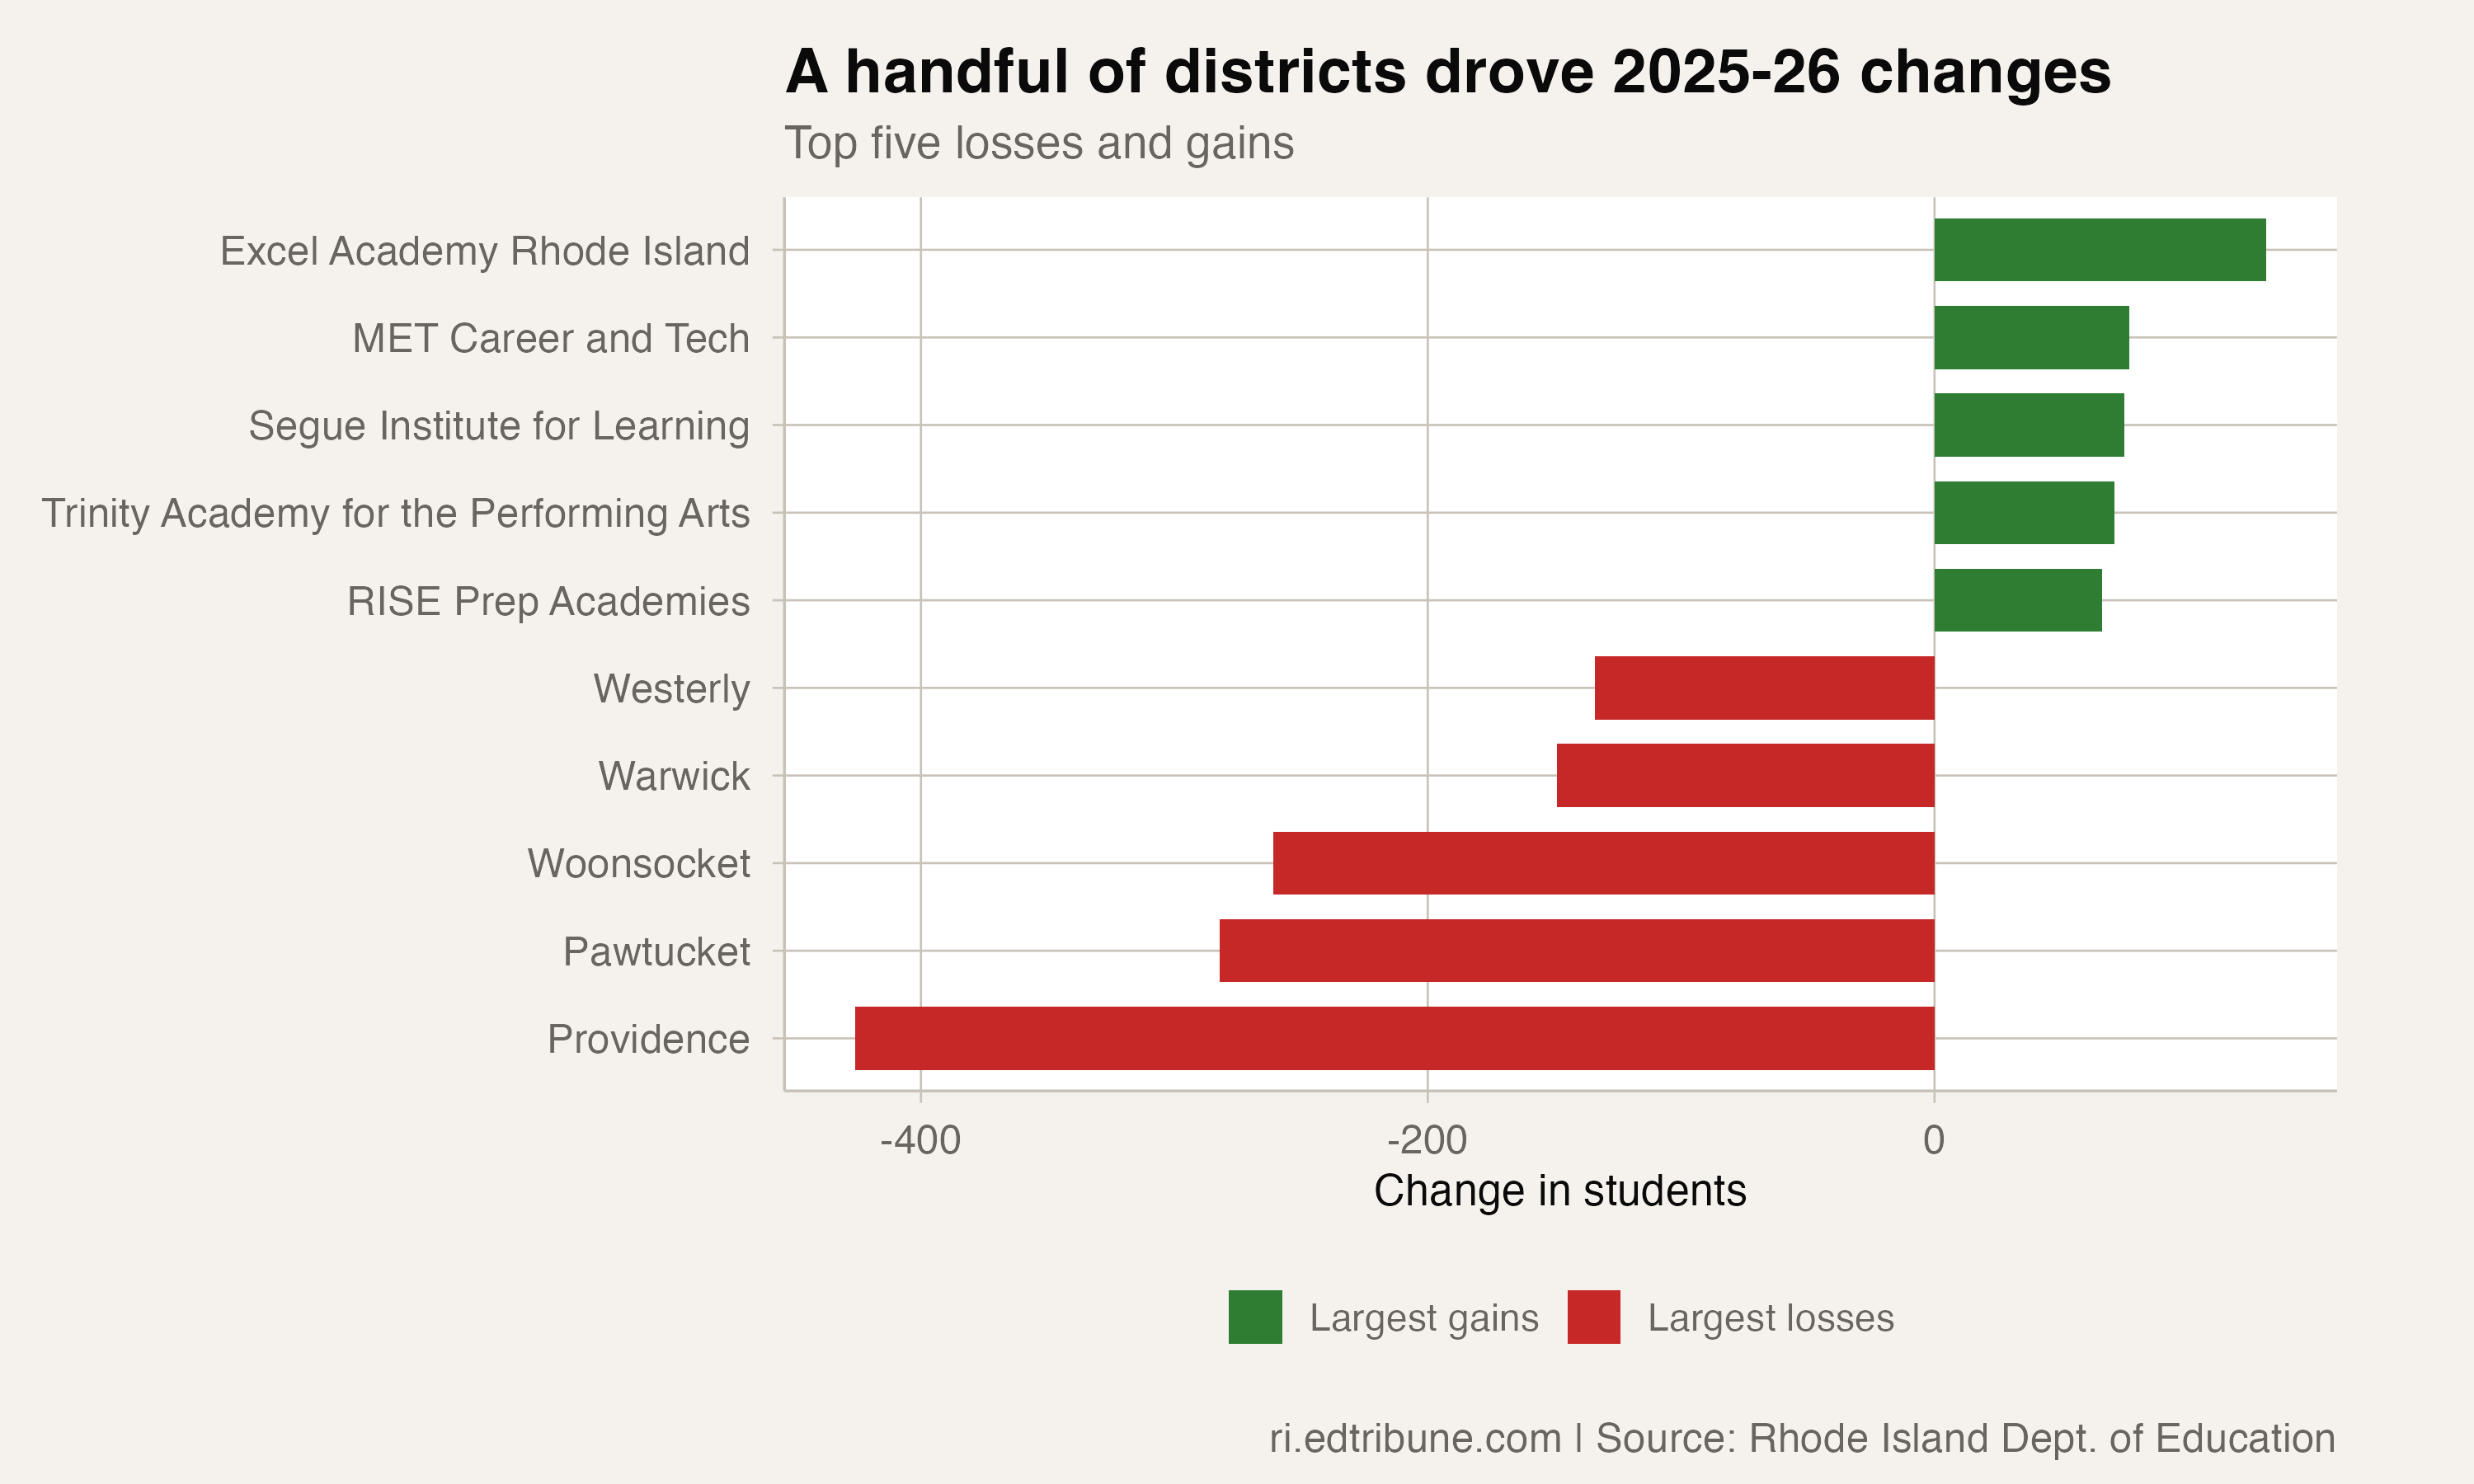
The losses are not spread evenly
District-level losses concentrated in the urban core. Providence (-426), Pawtucket (-282), and Woonsocket (-261) posted the largest one-year declines. Gains existed elsewhere, but they were nowhere near large enough to offset what the big systems lost.
That concentration matters because large districts carry a disproportionate share of statewide enrollment and fixed infrastructure — buildings, bus routes, central office staff. When losses pile up there, statewide totals keep falling even if dozens of smaller districts hold steady or tick upward.
In a system this size, the difference between losing 176 students and losing 2,149 is not cosmetic. It changes hiring windows, transportation planning, and capital project timing.
Birth rates, family choices, and the limits of this data
State leaders have explicitly identified lower birth rates and shifting family choices as key context for enrollment pressure (NBC 10, Jan. 30, 2025). That fits a straightforward supply-and-demand story: districts built for larger cohorts are now serving smaller entering classes.
Regionalization and consolidation discussions have intensified accordingly (Ocean State Media, Jan. 2025), consistent with a system trying to reconcile its current reality with inherited facility footprints and service models.
But this data cannot isolate the precise mix. Some of the one-year district movement may reflect redistribution within public education — students shifting to charters — rather than net exits from the system. Migration, private-school transfers, homeschooling growth, and cohort-size contraction all contribute; the enrollment file cannot tell us how much of each.
"We can't keep asking towns to raise their property taxes to fund education. It's not sustainable." — Rep. Megan Cotter, quoted by Ocean State Media
"It doesn't make sense sometimes to have two elementary schools and two districts side-by-side that are half empty." — Commissioner Angelica Infante-Green, quoted by Ocean State Media
Those quotations do not prove one cause for the 2025-26 drop. They do show how state leaders are framing the response: less short-term patching, more structural decisions.
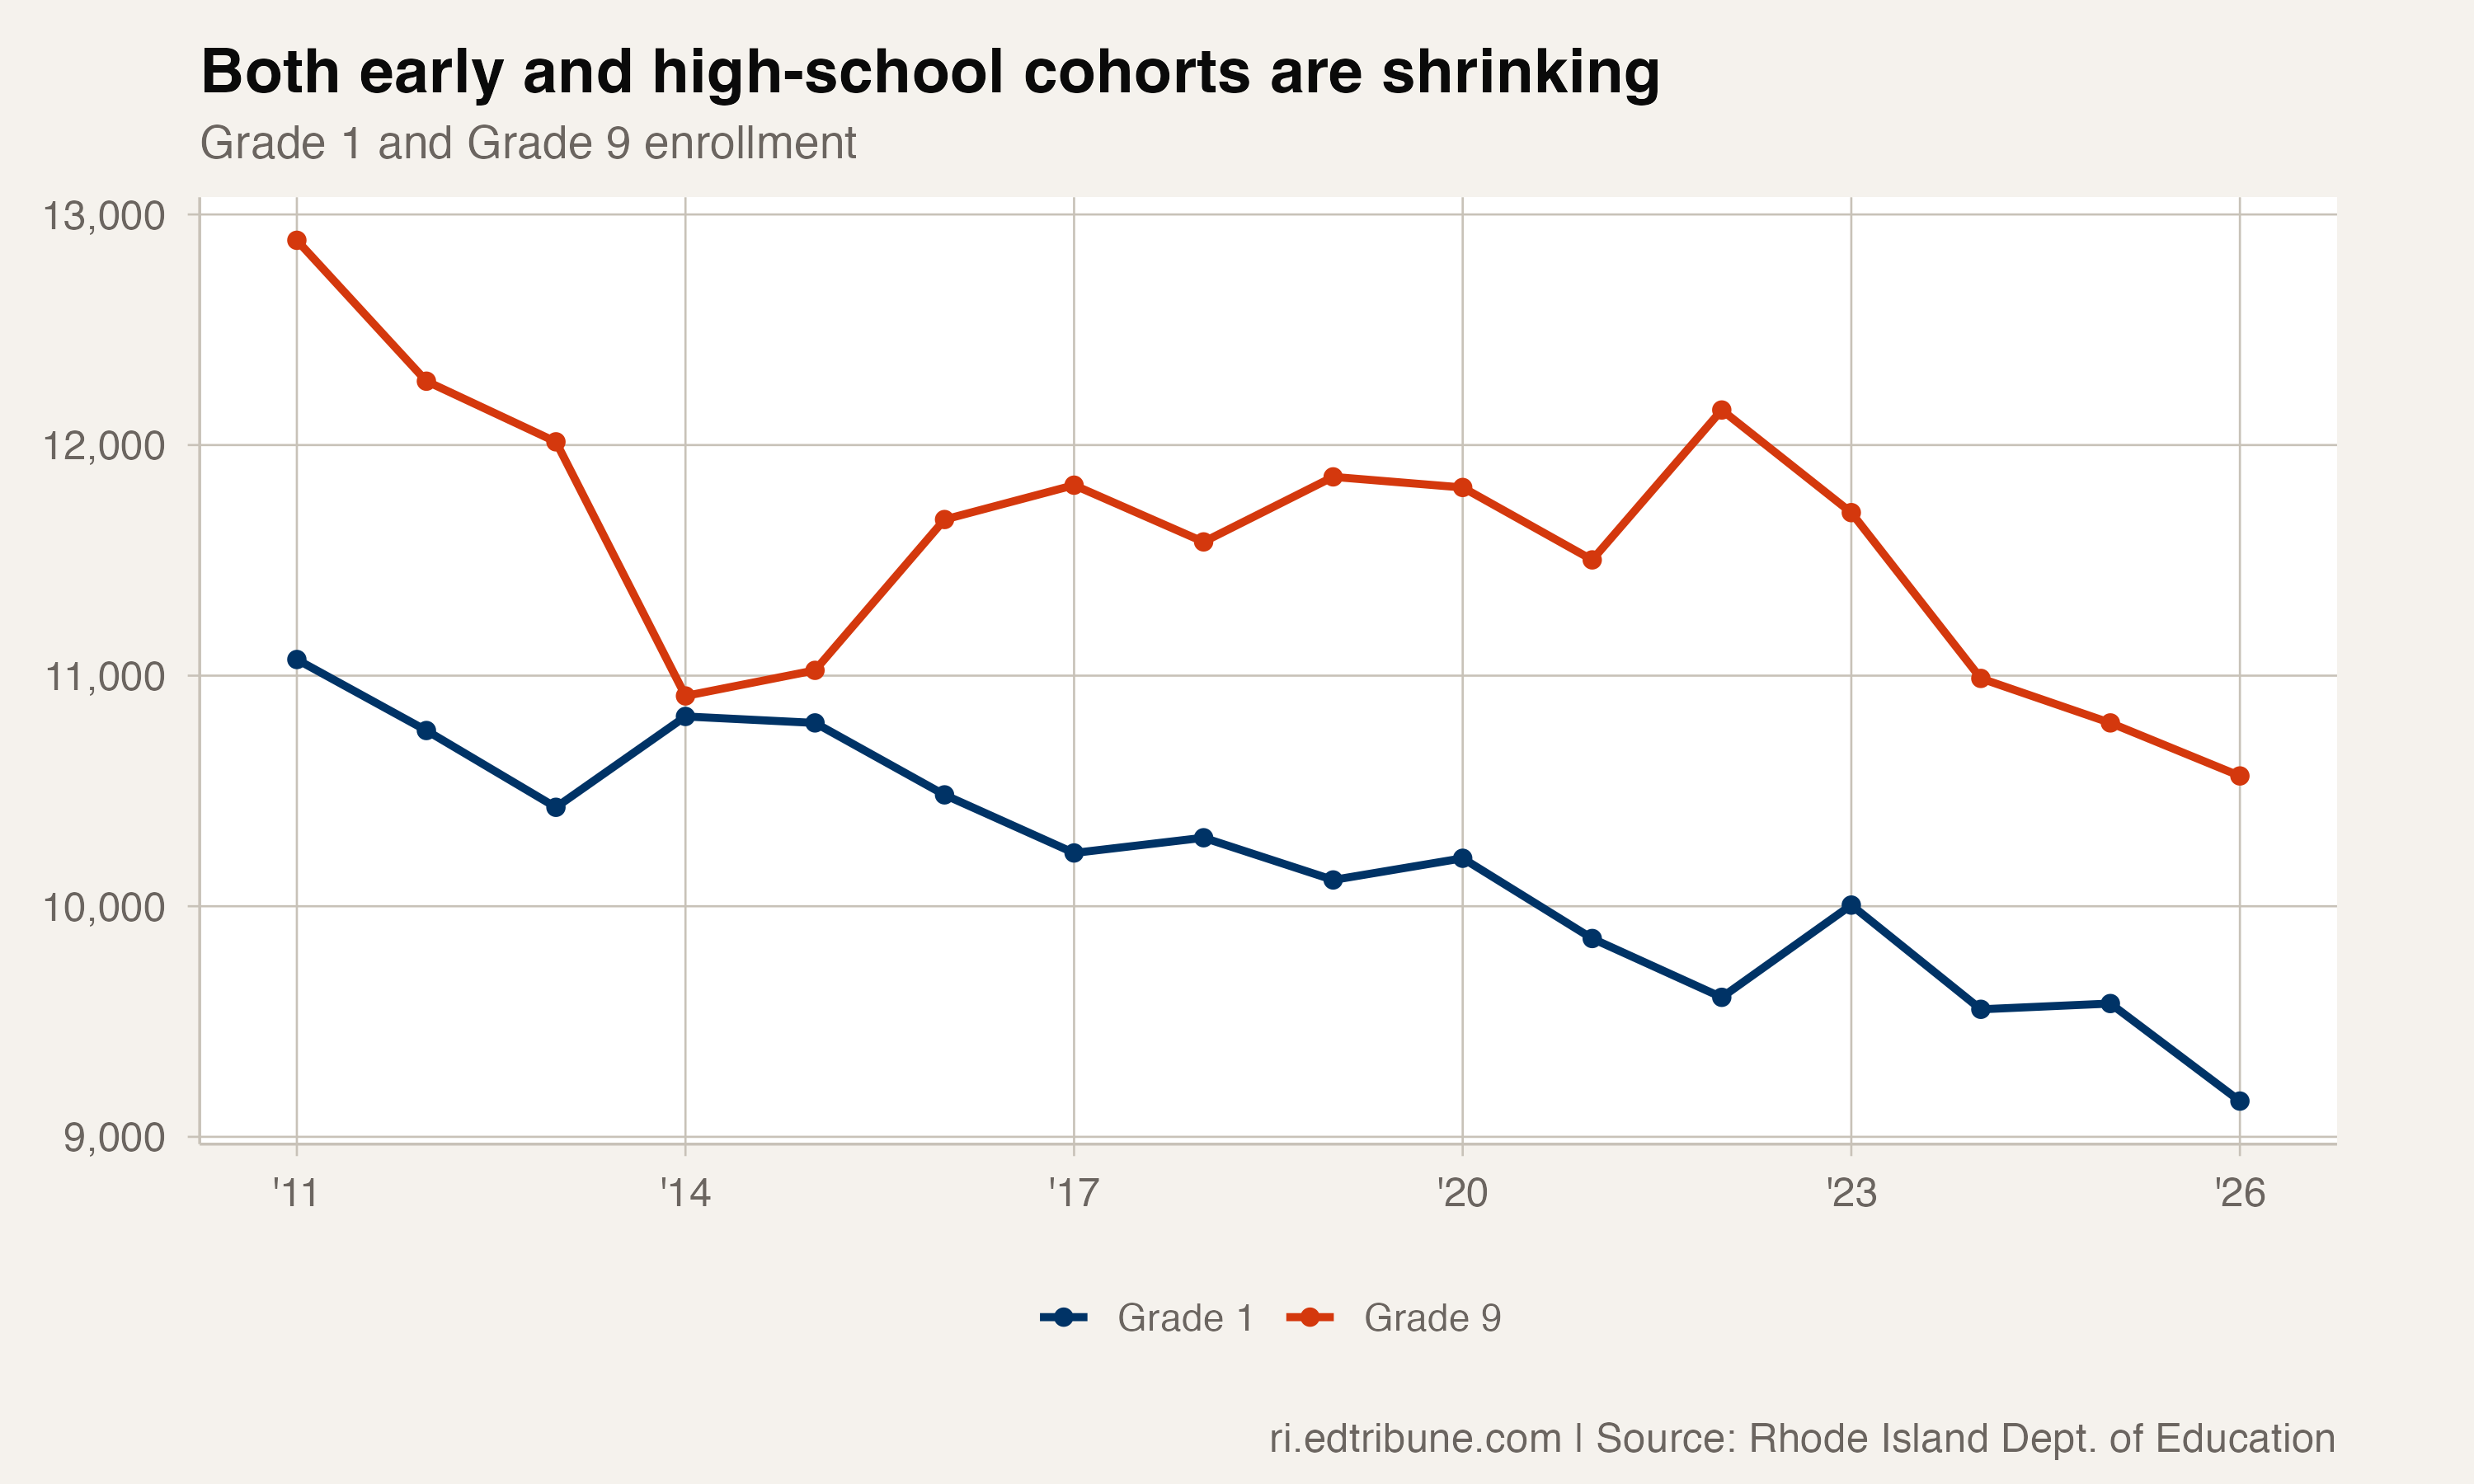
The pipeline is shrinking from both ends
The grade pipeline reinforces the risk. Statewide Grade 1 enrollment is down 17.3% since 2010-11 and Grade 9 is down 18.0%. Both incoming early cohorts and incoming high-school cohorts are smaller than they were at the start of this period.
Rhode Island allocates state education aid partly on enrollment (RIDE state education aid). Fewer students means less base funding, but buildings and bus routes do not shrink proportionally. Districts losing students at this pace face a stranded-cost problem — revenue falls faster than fixed costs can be unwound.
Elementary systems face fewer incoming students while secondary systems lose scale in later cohorts. When both ends move down, districts have less room to rebalance internally.
What to watch next
The 2026-27 enrollment file, due in fall 2026, will determine whether the 2025-26 drop was a one-year correction after an unusually flat year or the start of a steeper leg down. If the annual loss stays above 1,500, districts will face mounting pressure to move from annual reactive cuts to multi-year right-sizing plans — consolidating buildings, merging grade configurations, and renegotiating transportation routes. The regionalization bills now circulating in the General Assembly will either gain urgency or lose it based on that single number.
RELATED: White students are no longer the majority in Rhode Island schoolsET
Detailed code that reproduces the analysis and figures in this article is available exclusively to EdTribune subscribers.
Discussion
Sign in to join the discussion.
Loading comments...