In this series: Rhode Island 2025-26 Enrollment.
Nearly one in five students in Rhode Island's public schools now receives special-education services — and the state has no clear answer for why.
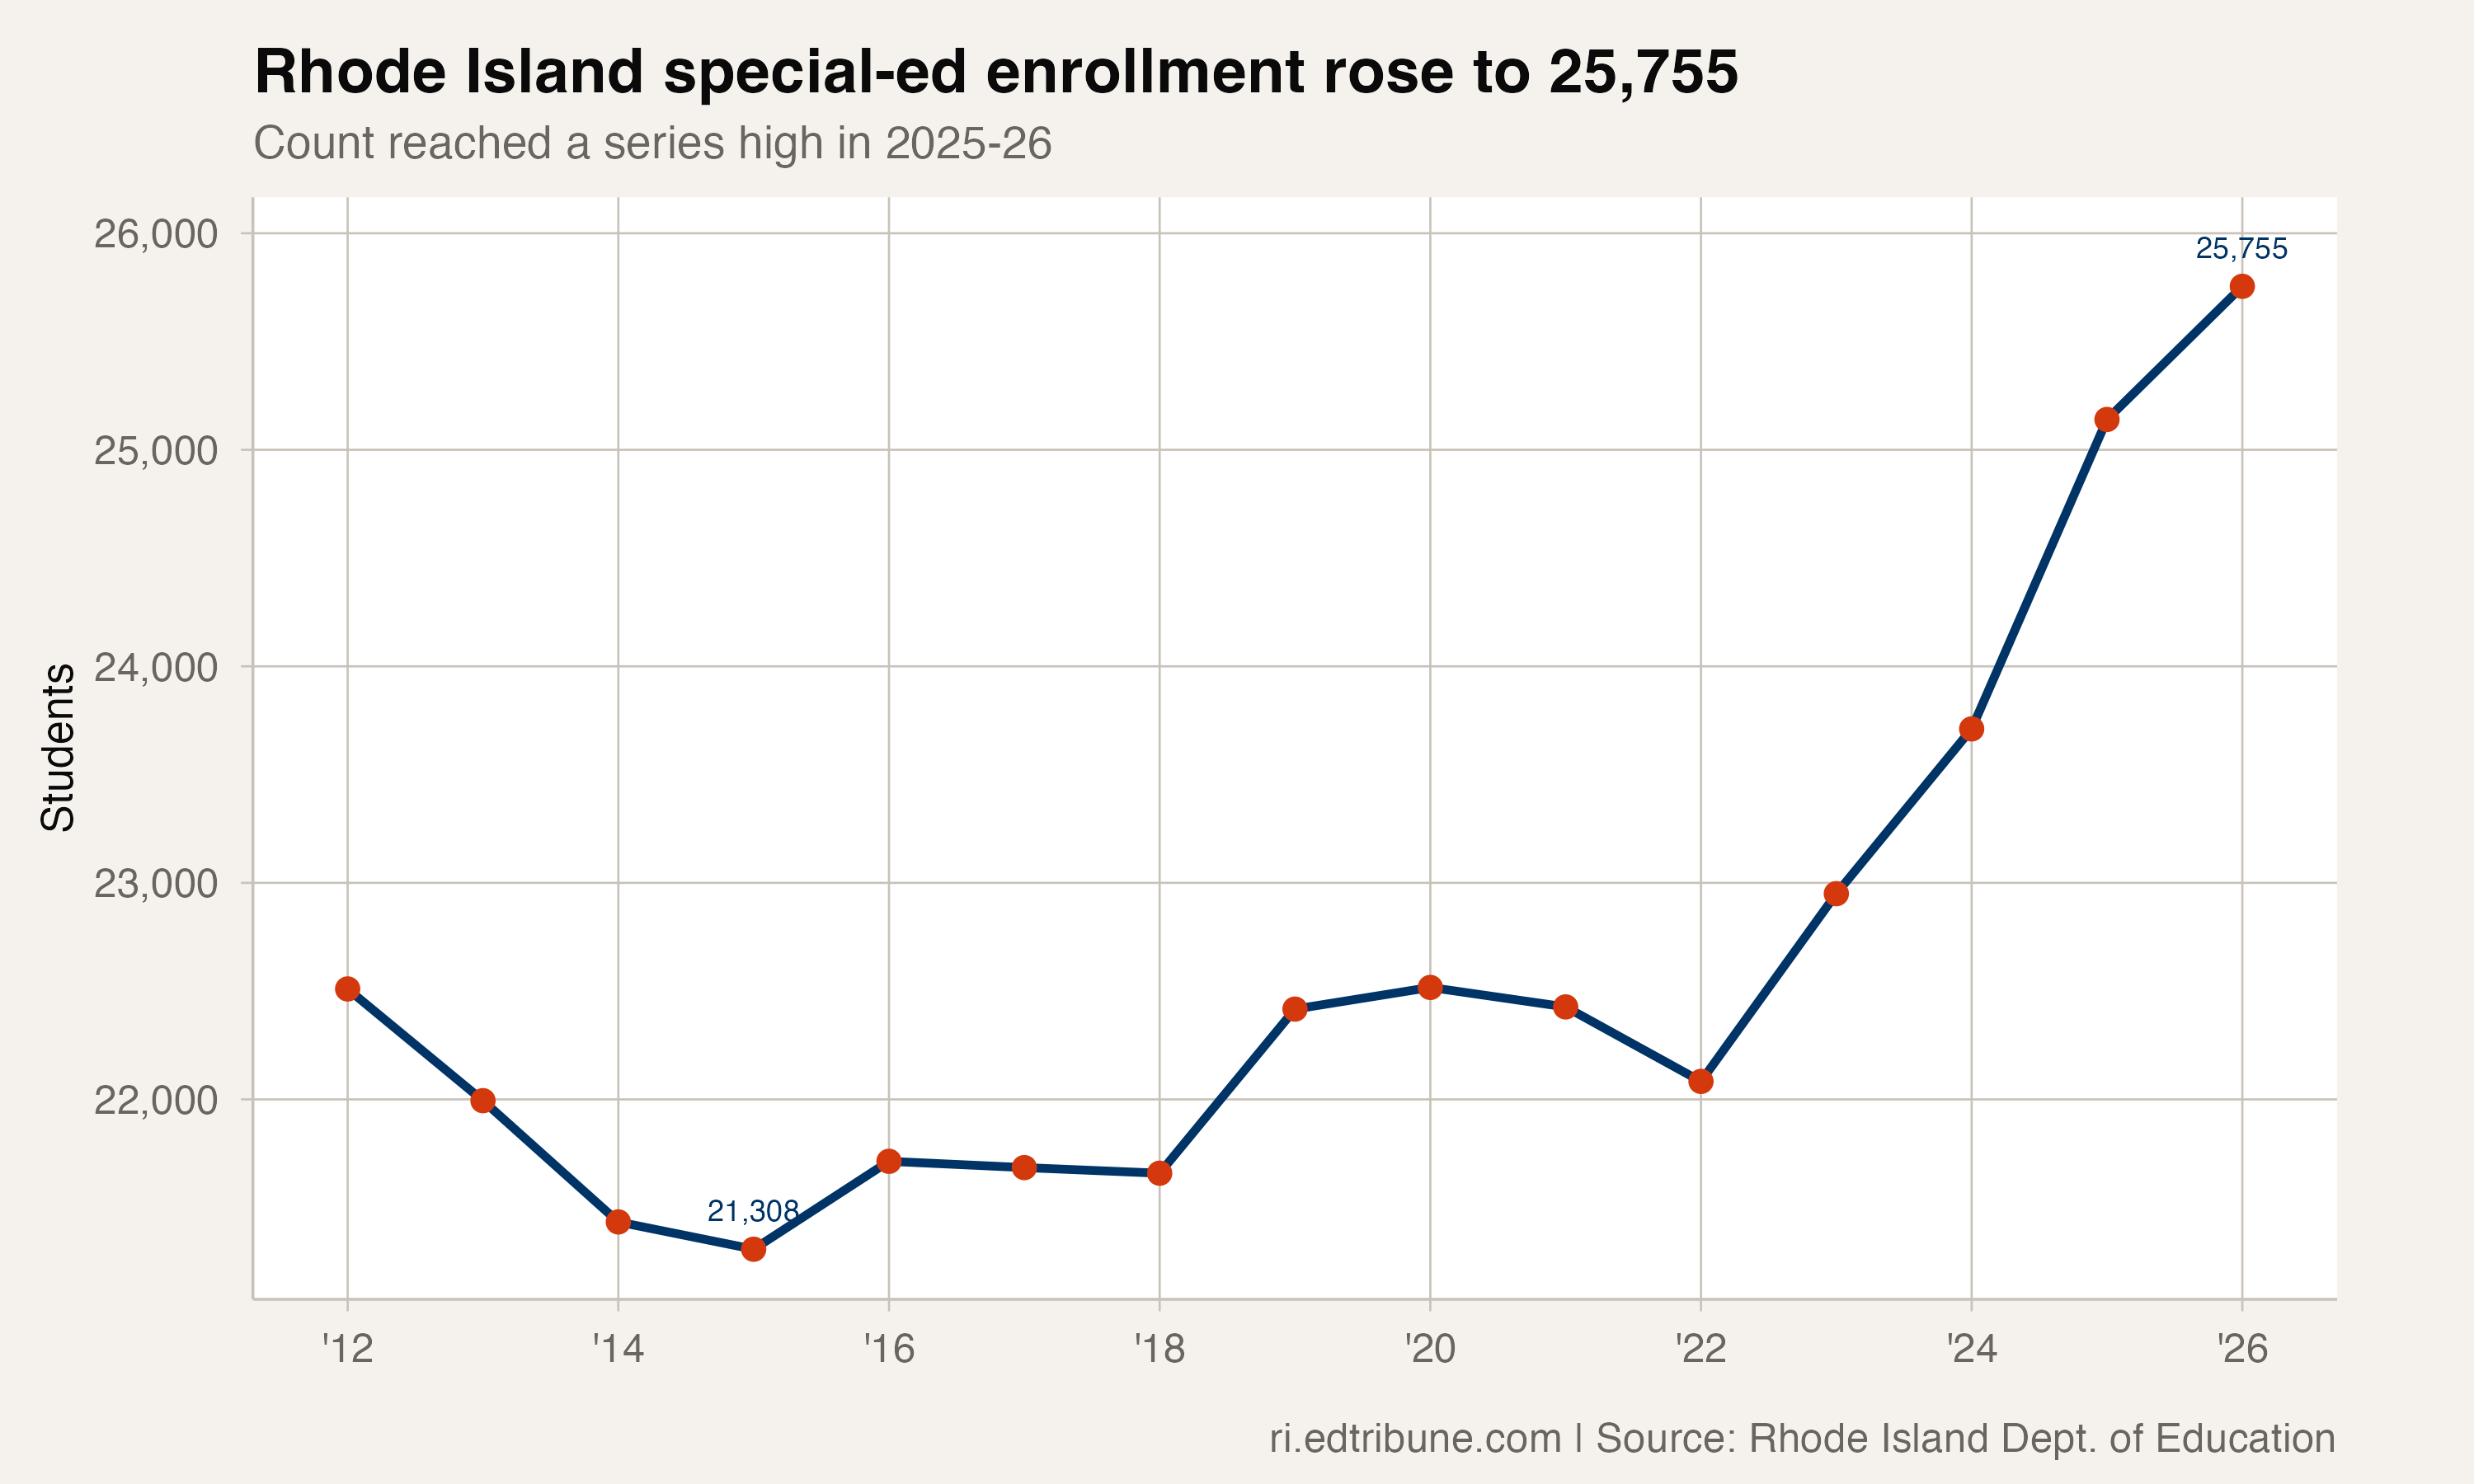
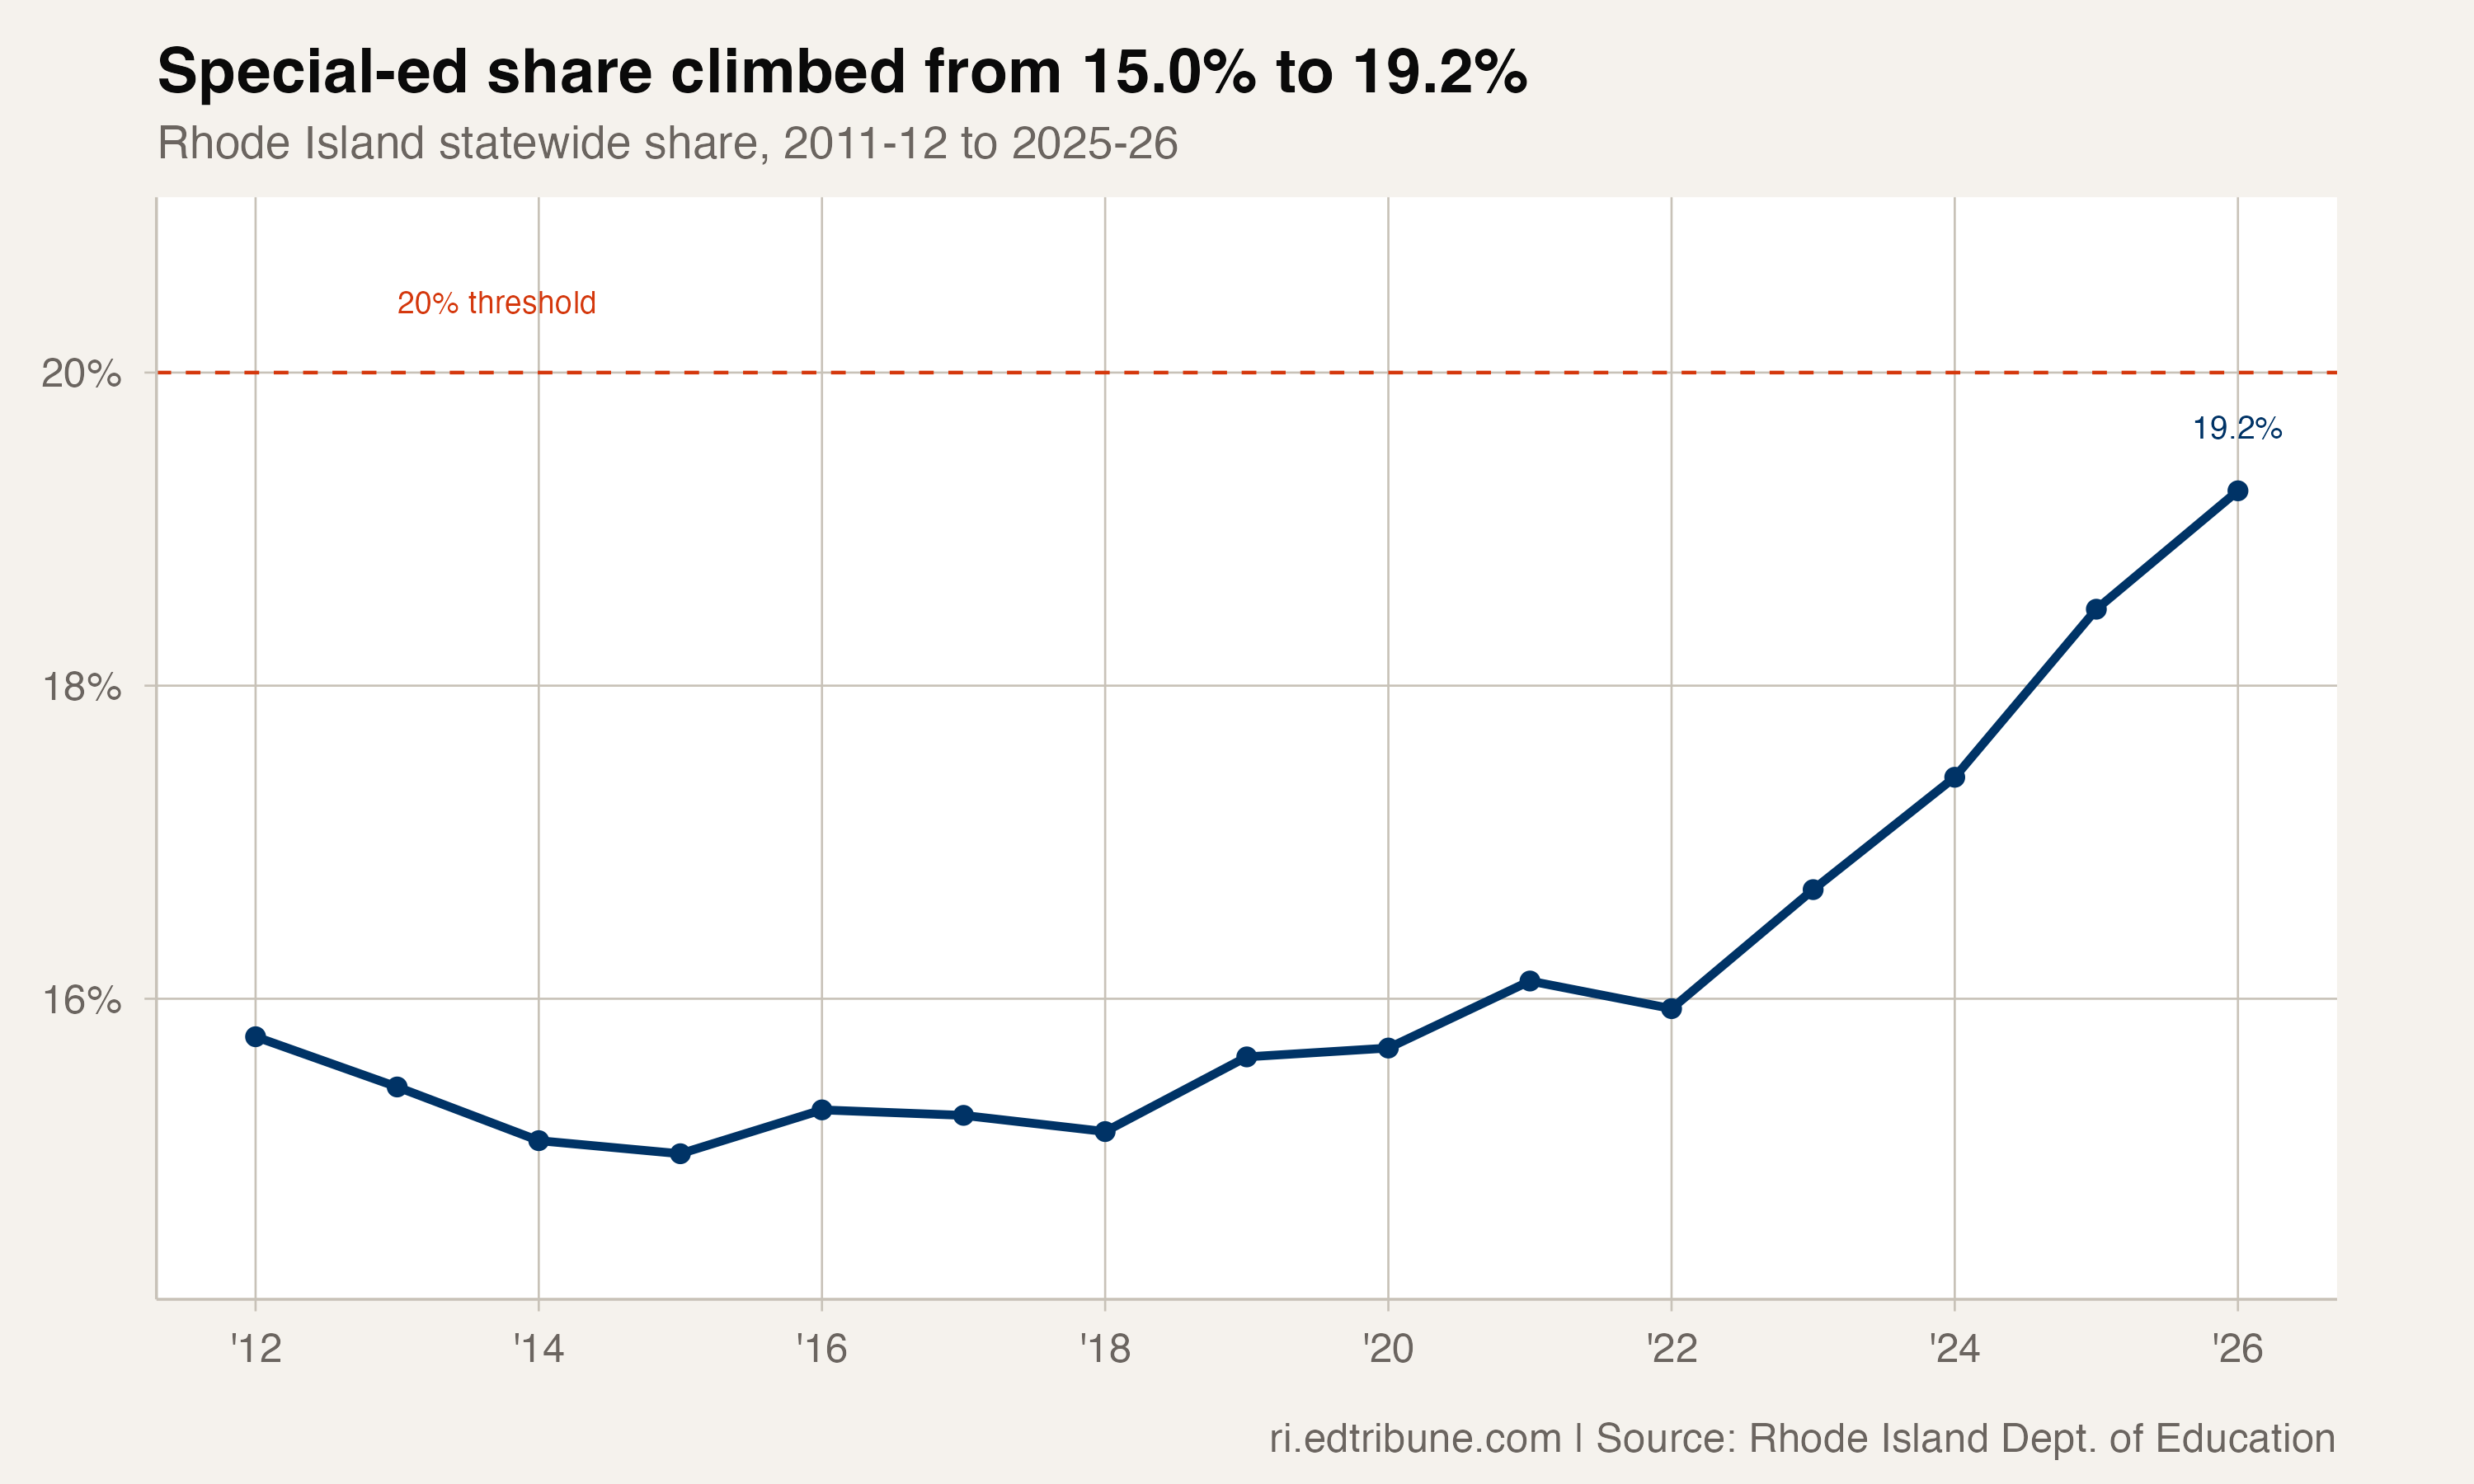
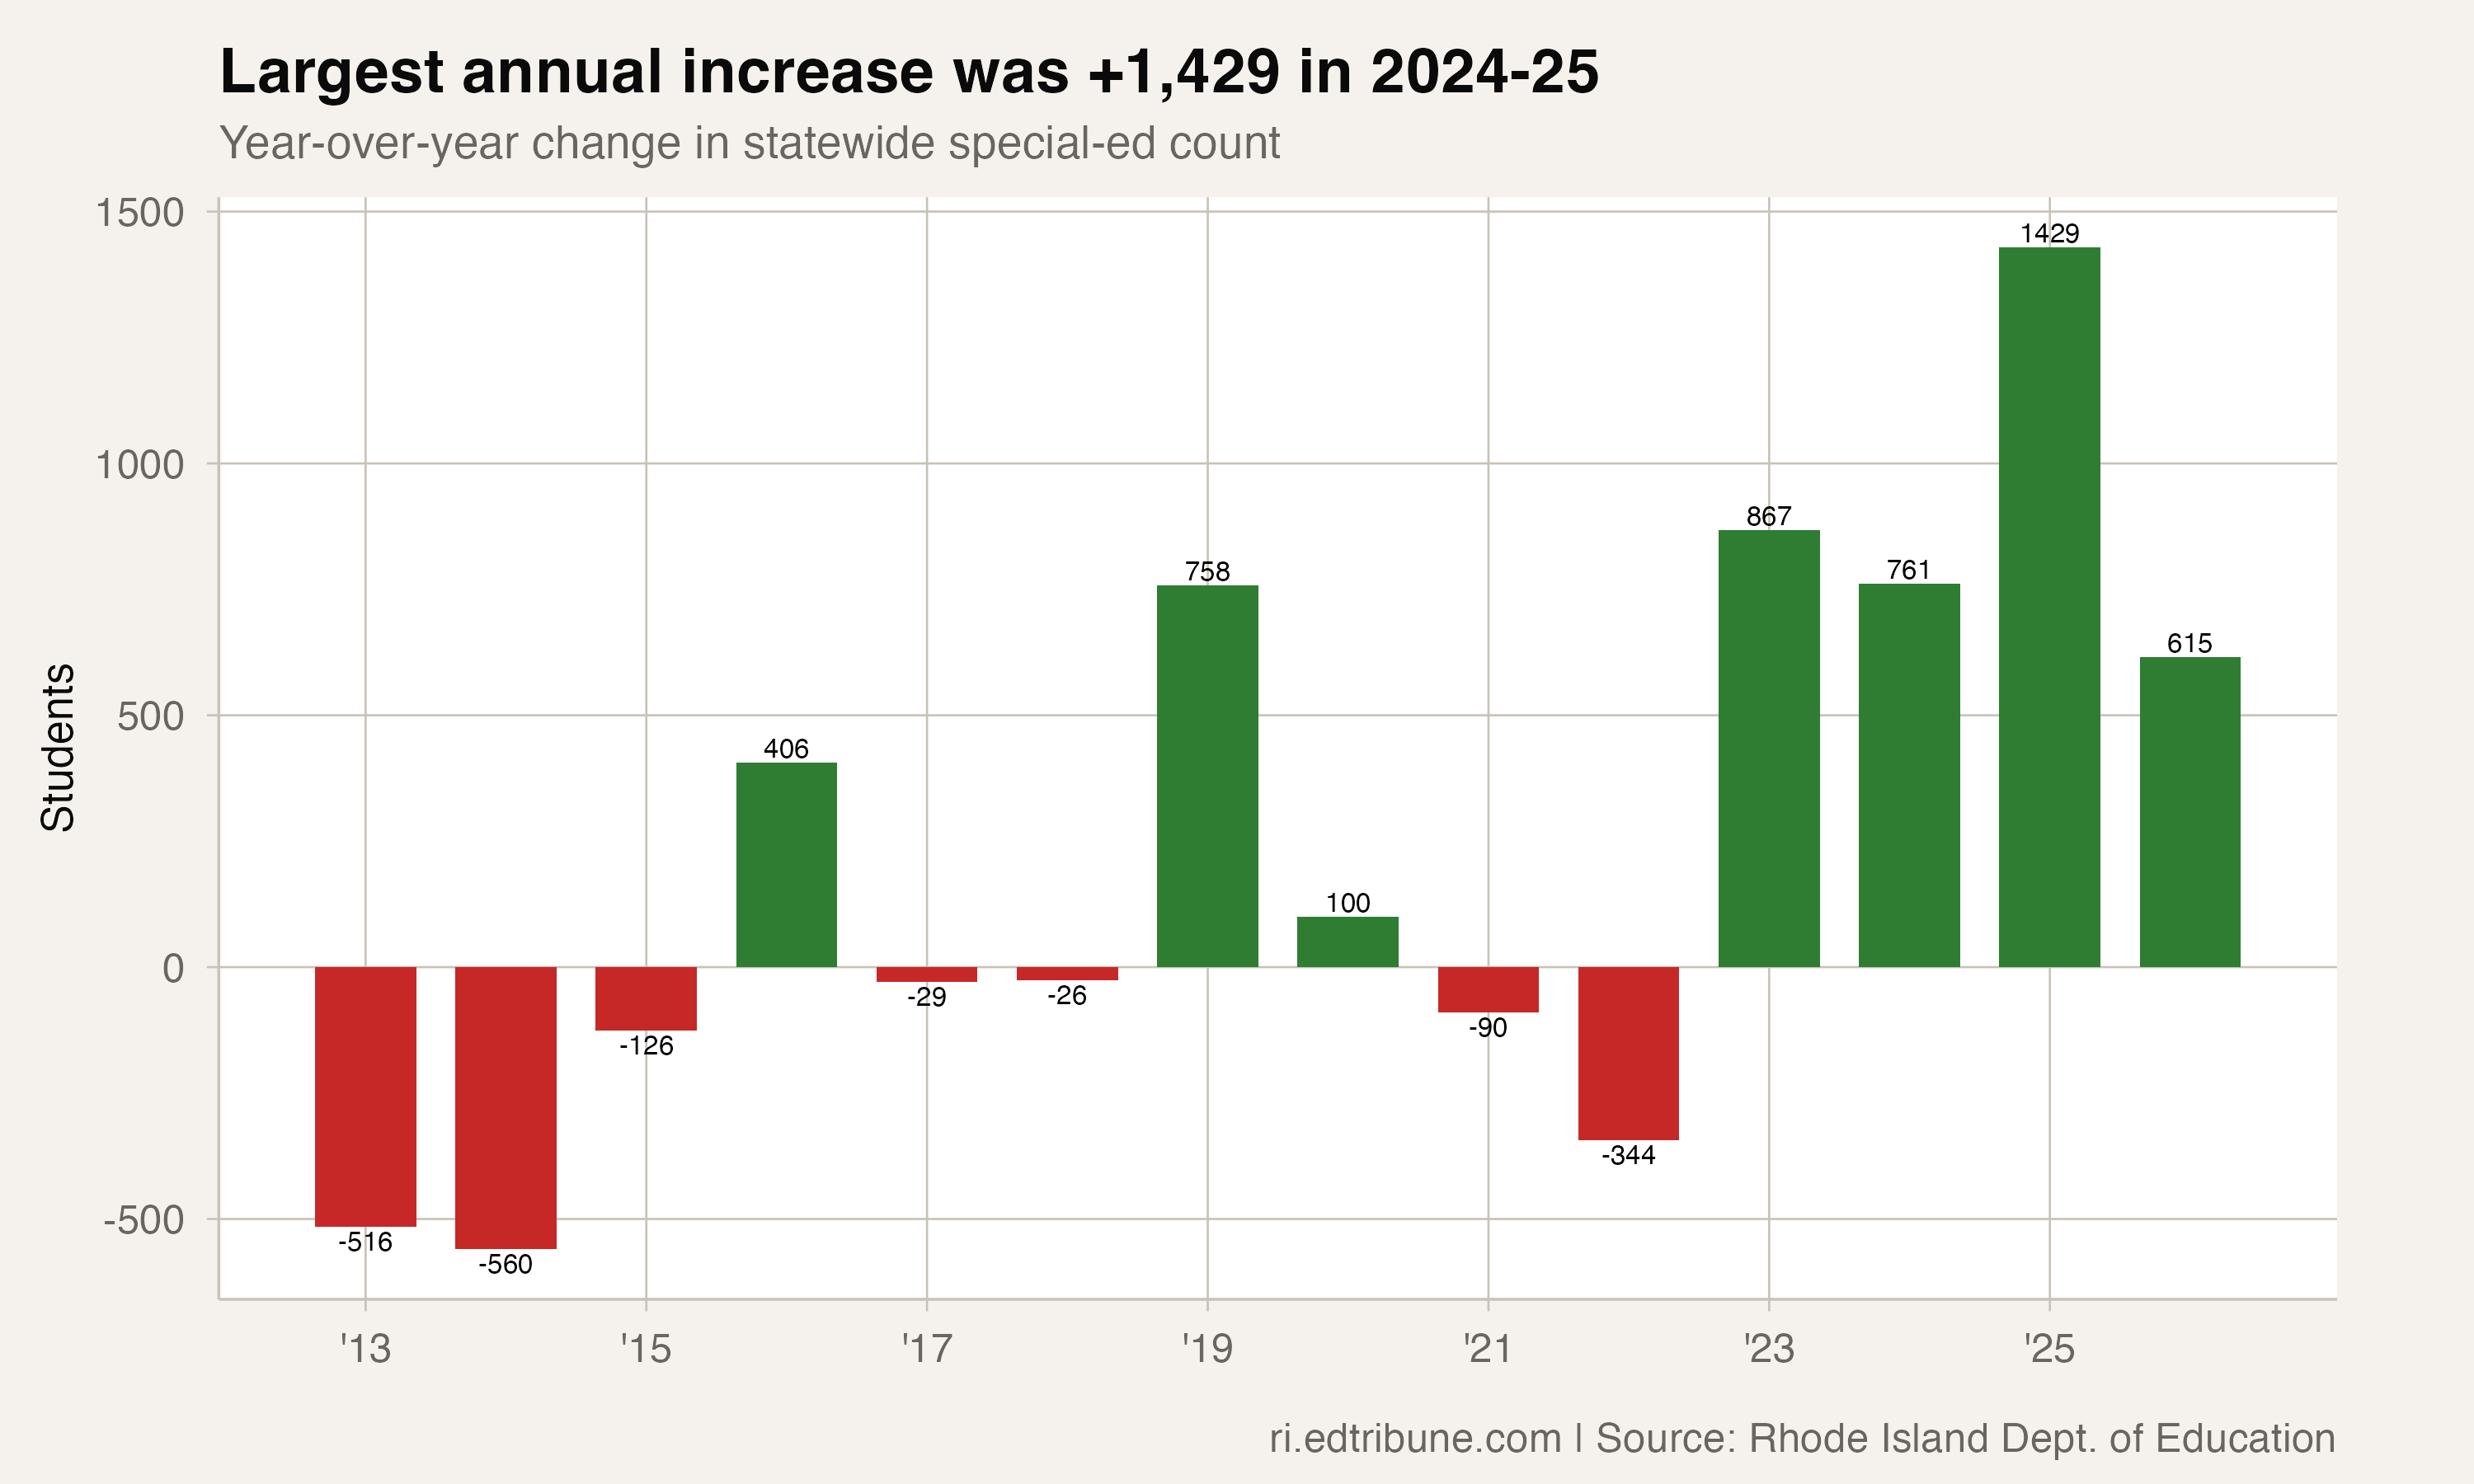
The statewide count reached 25,755 in 2025-26, the highest level in this data series, pushing the share to 19.2%. That is up from a low of 15.0% in 2014-15, an era when identification rates were falling nationally. The reversal since then has been steady, but the acceleration after 2021 is what stands out: 3,328 additional students in five years, including a single-year jump of 1,429 in 2024-25.
A shrinking system with a growing share
The special-education increase did not happen in a vacuum. It arrived alongside a sustained enrollment decline that has changed the state's fiscal math.
Rhode Island's public-school total fell from 143,557 in 2019-20 to 133,829 in 2025-26 — a loss of 9,728 students. As the overall system contracted, the special-education population expanded. The result is a composition shift: fewer students overall, but a larger fraction requiring services that carry higher per-pupil costs.
RELATED: Rhode Island enrollment drops below 135,000ET
19.2% of Rhode Island students now receive special-education services, up from 15.0% in 2014-15.
| Metric | Value |
|---|---|
| Special-ed count, 2025-26 | 25,755 |
| Special-ed share, 2025-26 | 19.2% |
| Special-ed share low point (2014-15) | 15.0% |
| Special-ed count change since 2020-21 | +3,328 |
| Largest single-year increase | +1,429 (2024-25) |
| Statewide total enrollment change since 2019-20 | -9,728 |
Denominator effect or something deeper?
Part of the share increase is arithmetic. When total enrollment falls, subgroup shares can rise even with smaller absolute changes — the denominator shrinks. But the absolute count increase of 3,328 since 2020-21 makes clear this is not only a denominator story. The state is identifying more students, not just recalculating the same ones against a smaller base.
What enrollment data alone cannot answer is why. The increase could reflect genuine changes in student need, shifts in identification practices, improved screening and awareness, changes in service models, or some combination. No single public source included in this workflow directly attributes Rhode Island's full post-2021 rise to one mechanism.
The data gap
The statewide enrollment file does not provide student-level trajectories, disability-category transitions, evaluation timing, or transfer origin and destination. Without those fields, this analysis cannot separate:
- newly identified students,
- students moving into Rhode Island districts,
- students shifting between sectors,
- classification or reporting-process effects.
Rhode Island is not unique in this limitation — most state enrollment datasets track counts, not flows. But the limitation matters more when counts are moving this fast.
Budget math that does not add up
A higher special-education share increases structural cost pressure. Many IEP-driven instructional programs and support services carry higher per-pupil staffing and compliance requirements than general-education models. Districts may need to expand special-education staffing pipelines, related-service capacity, and placement options while their total enrollment — and therefore their base state aid — continues to decline.
That combination creates a specific kind of budget friction: fewer total students generating less revenue, but a more intensive service mix demanding more spending per student. The special-education share is rising in parallel with the English learner share and the economically disadvantaged share, compounding the mismatch.
What comes next
The 2024-25 jump of 1,429 students was the largest single-year increase in this series. Whether that pace continues in the next enrollment cycle — or whether it was an anomaly driven by a specific cohort or policy change — will shape how districts plan staffing and budgets for 2027-28. RIDE's March 2026 enrollment update, which has historically revised October counts, could also shift these figures. If the post-2021 trajectory holds, Rhode Island will cross the one-in-five threshold within a year or two, a milestone that would put the state well above the national average and intensify pressure on a funding formula already under review.
Detailed code that reproduces the analysis and figures in this article is available exclusively to EdTribune subscribers.
Discussion
Sign in to join the discussion.
Loading comments...