In this series: Rhode Island 2025-26 Enrollment.
Something happened to economic disadvantage in Rhode Island's schools between 2023-24 and 2024-25 — and nobody has explained what.
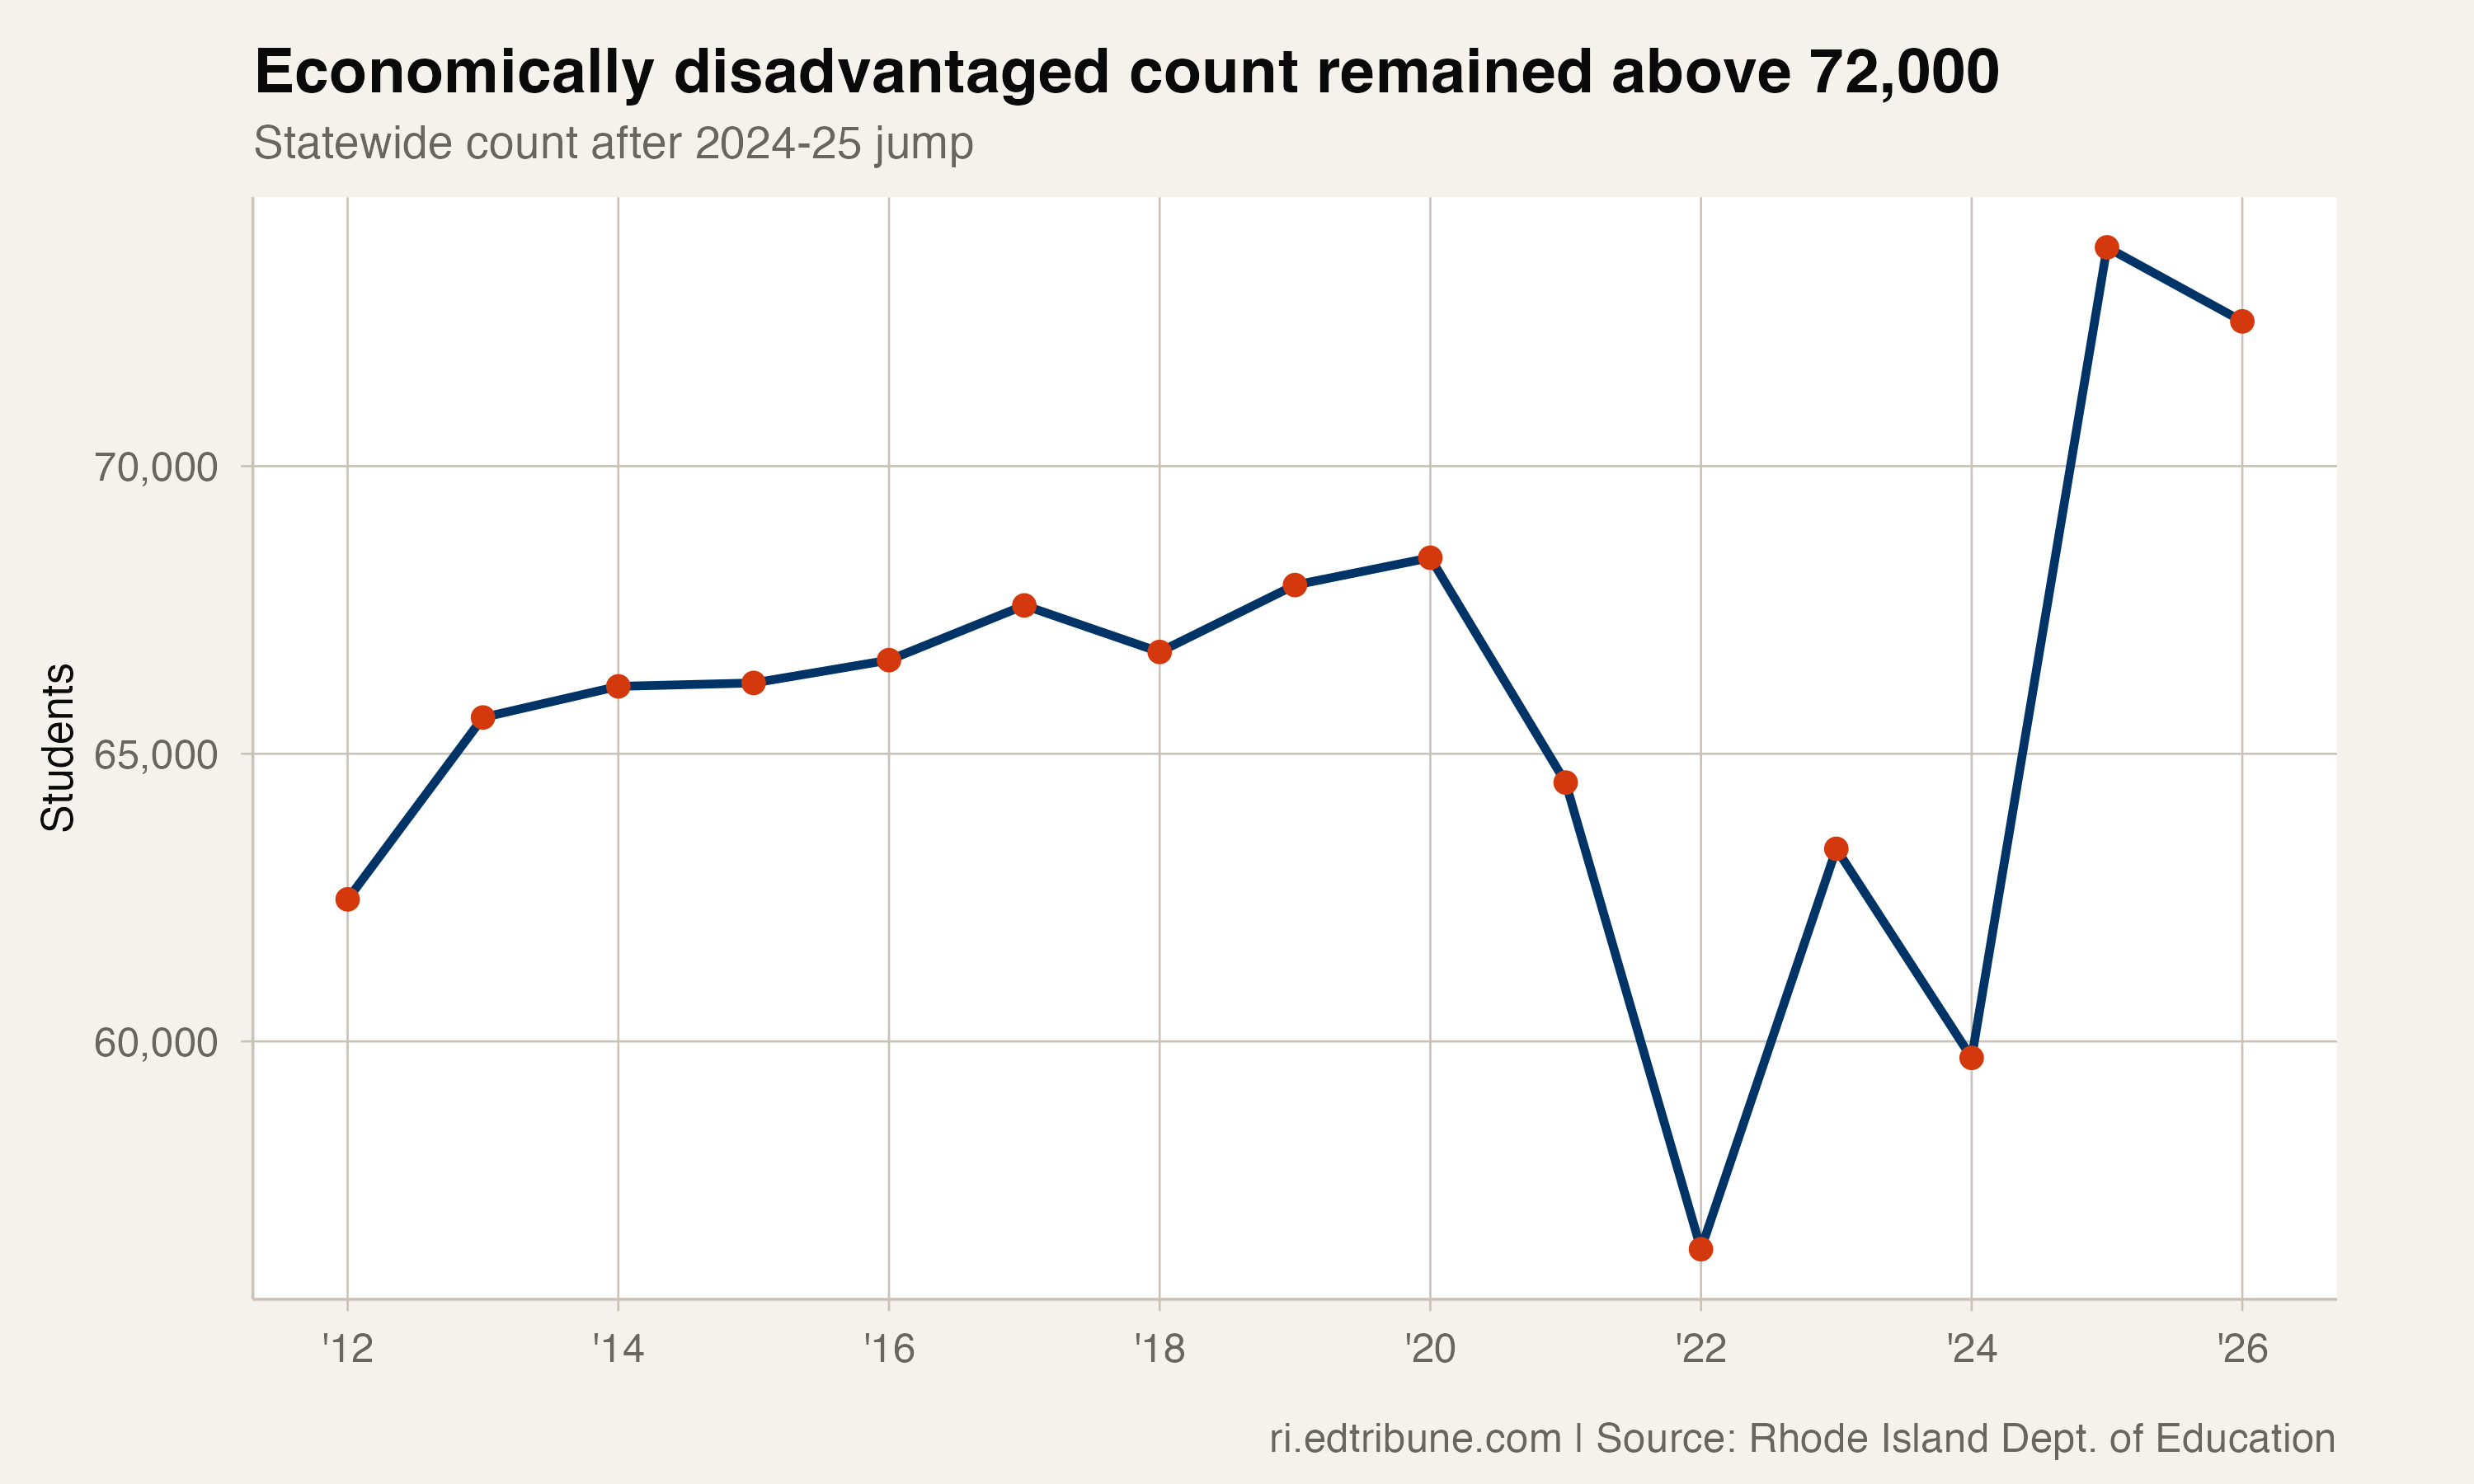
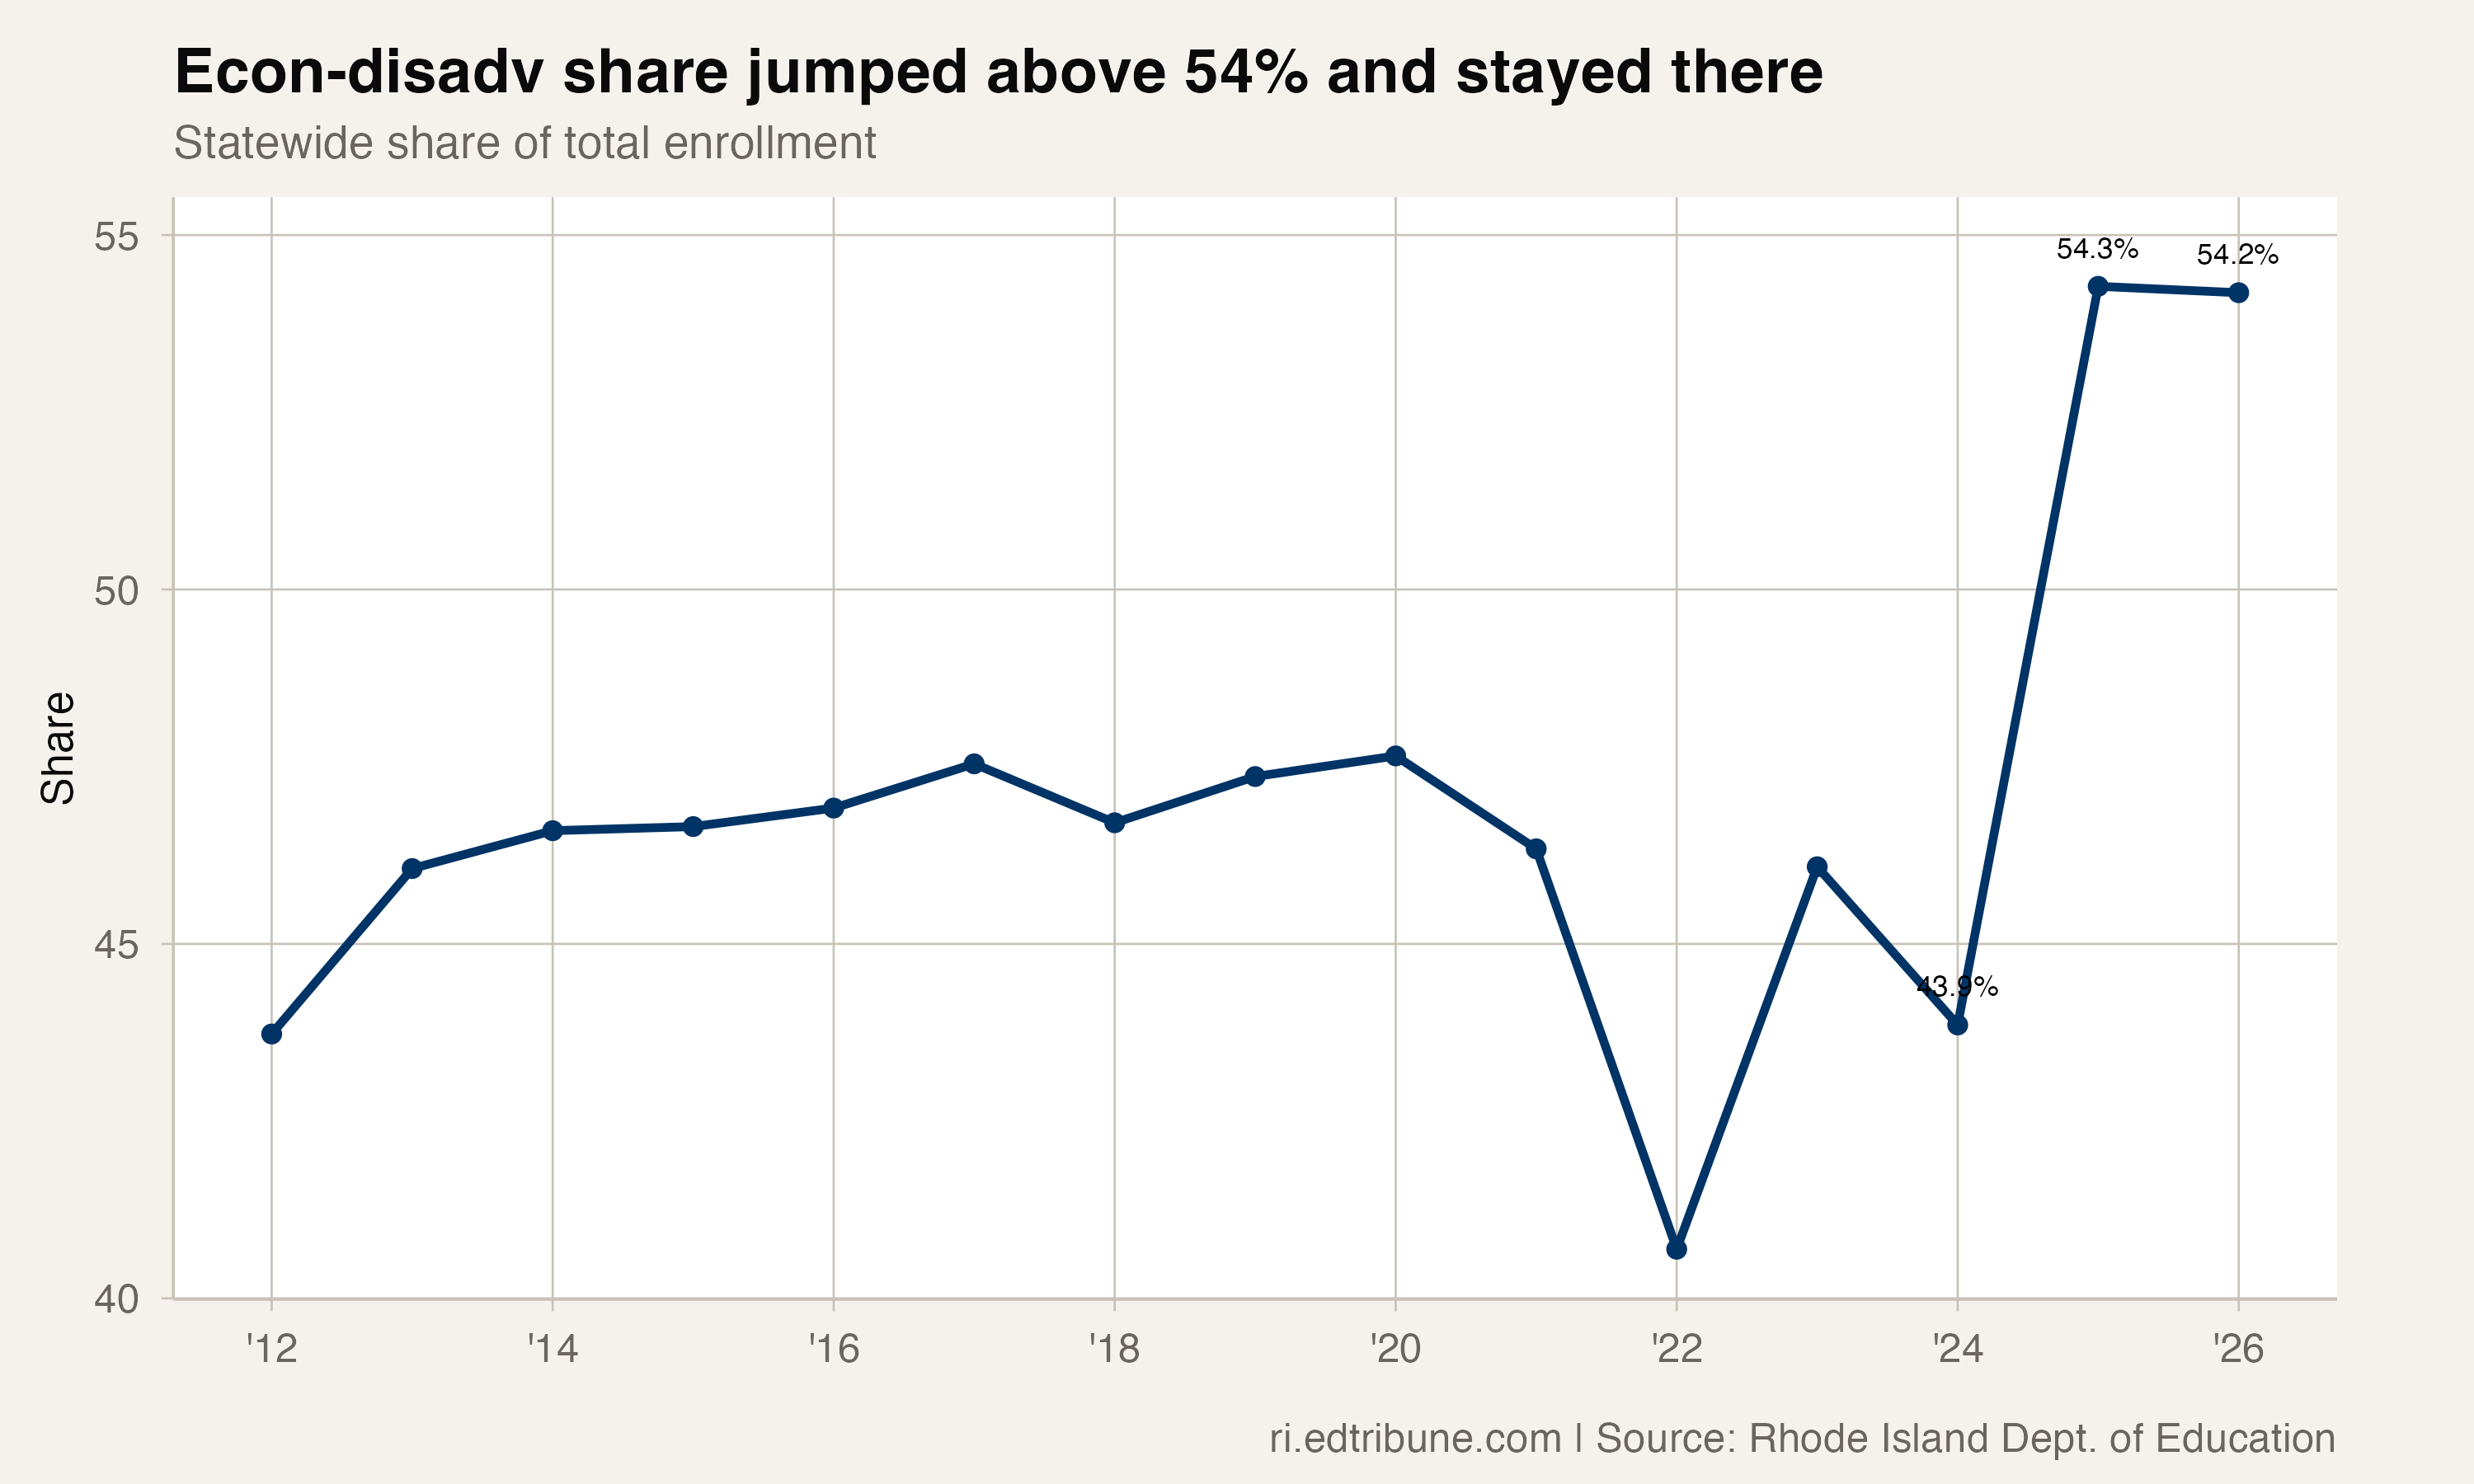
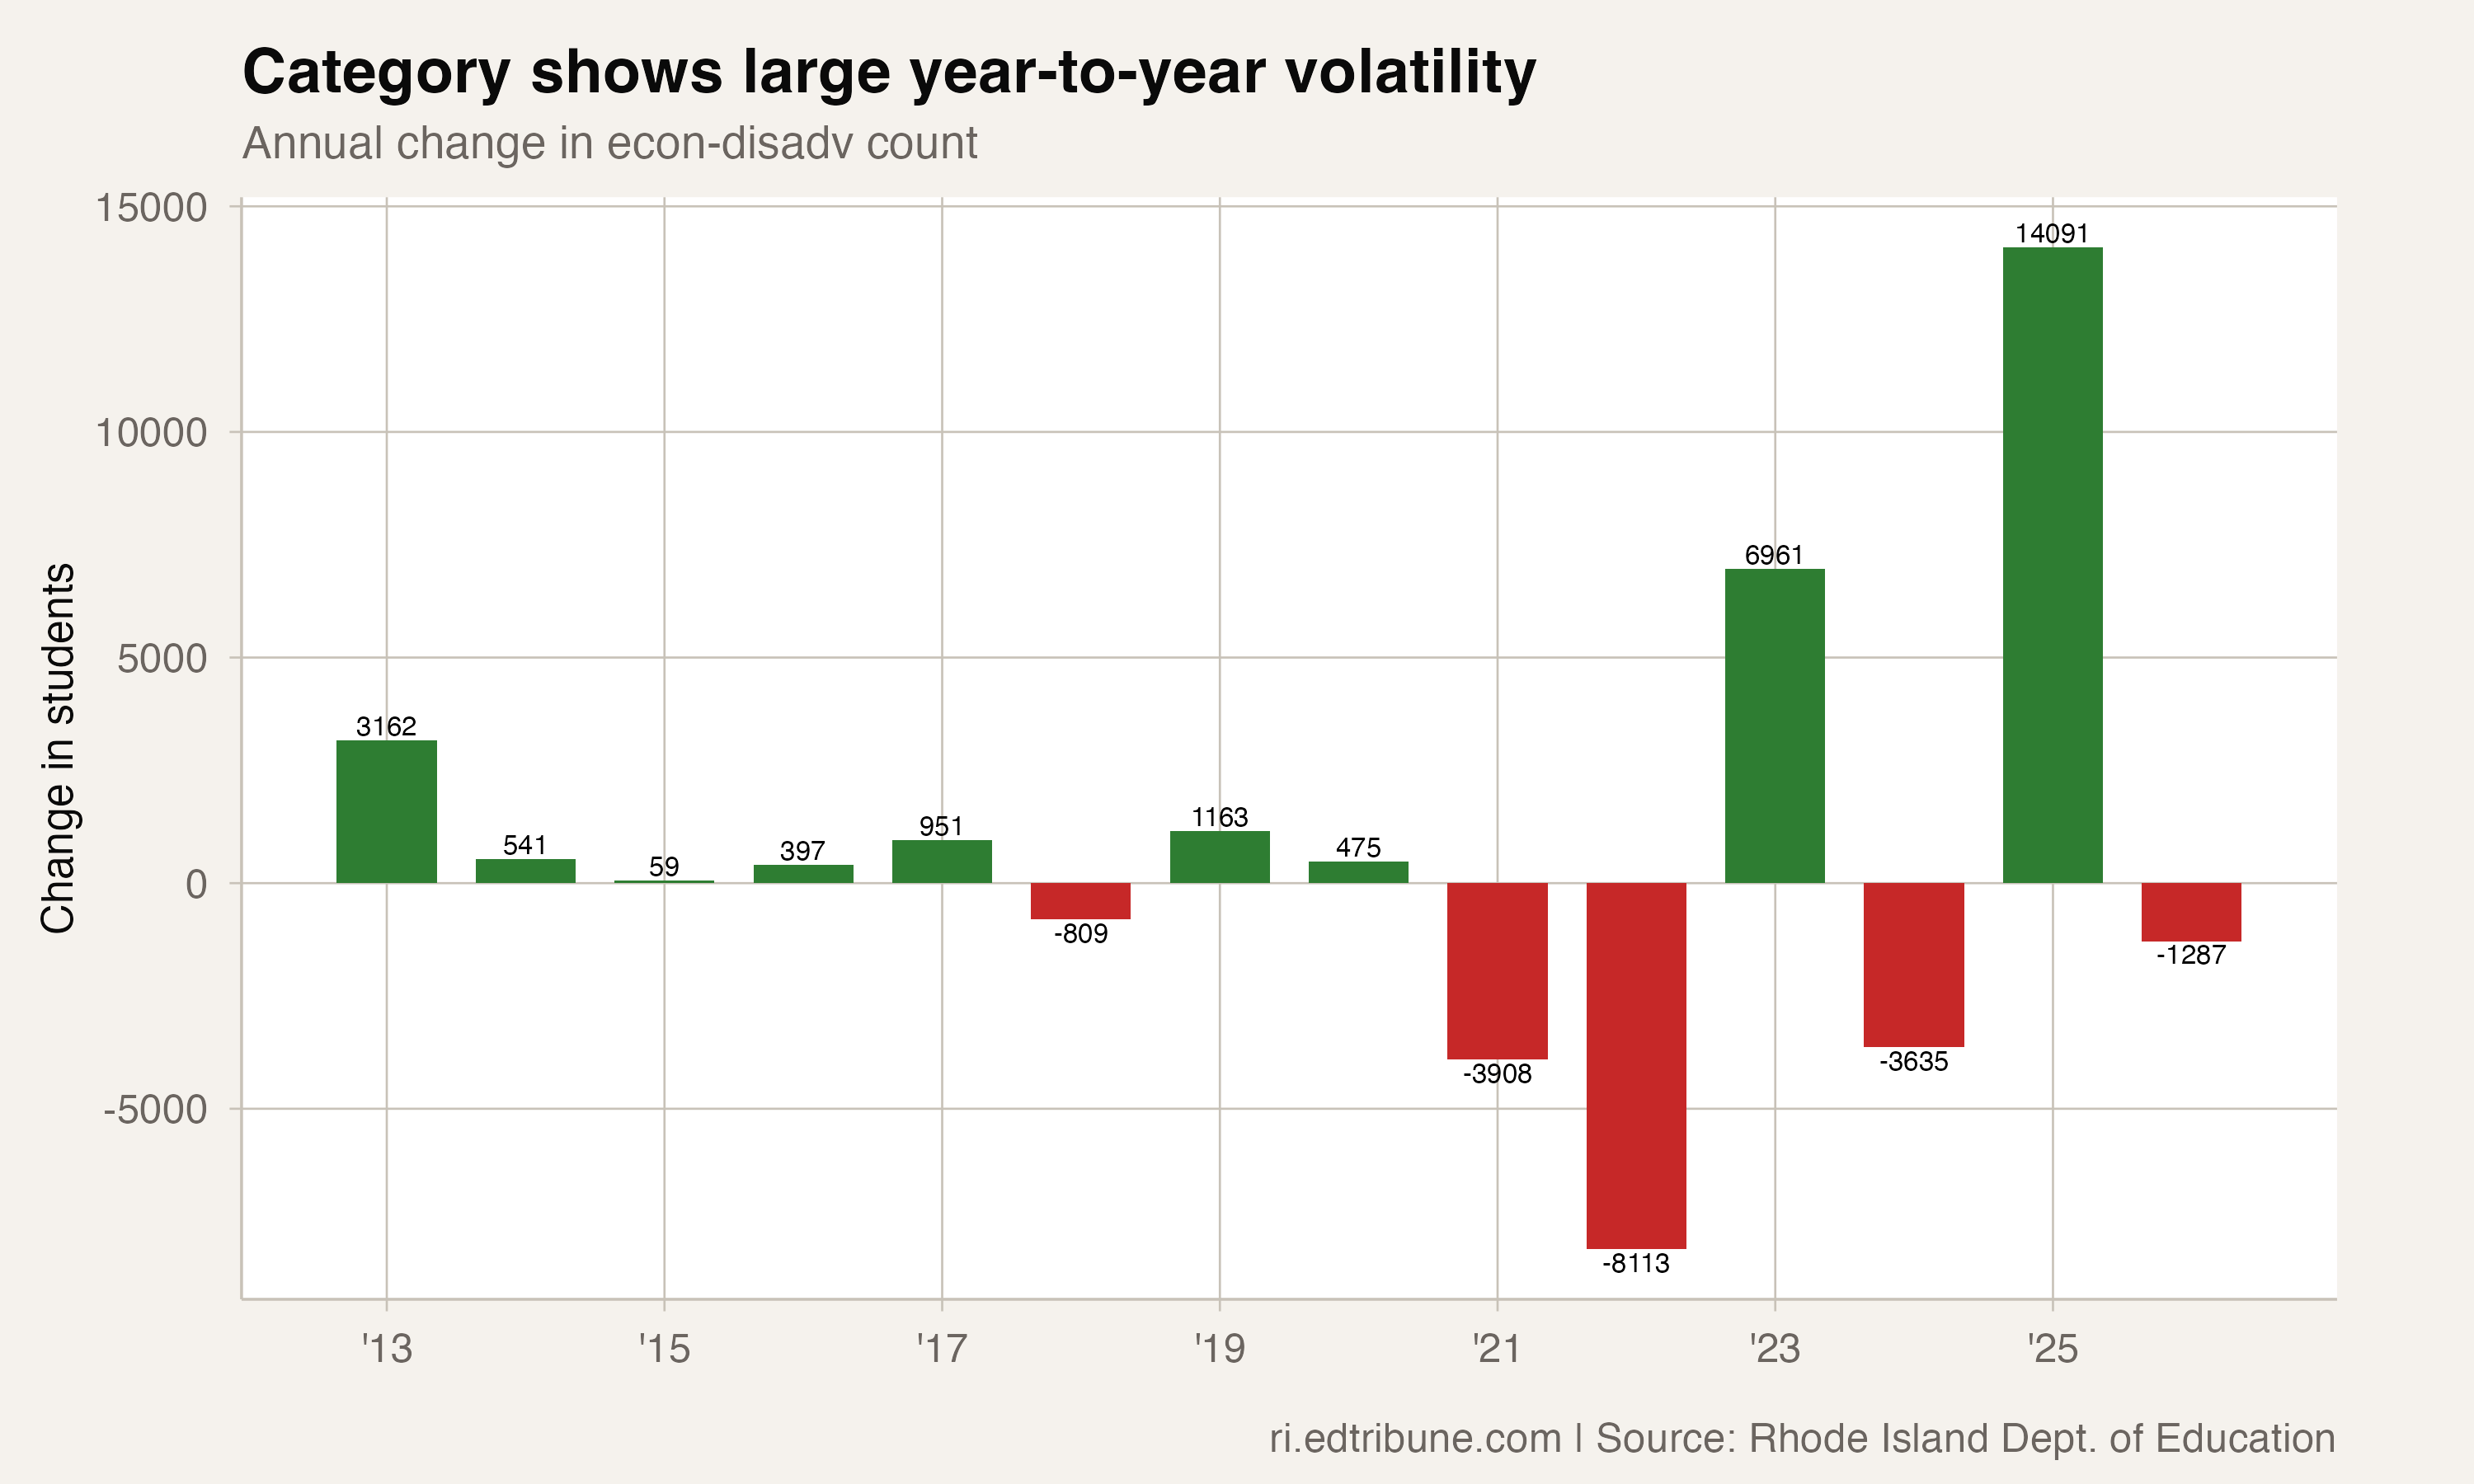
In a single year, the share of students classified as economically disadvantaged jumped from 43.9% to 54.3%, an increase of 10.4 percentage points. The count surged by 14,091 students. Then, in 2025-26, the numbers barely moved: 72,517 economically disadvantaged students, 54.2% of statewide enrollment. The spike stuck.
A ten-point jump that came from nowhere
The 2024-25 shift was enormous. A 10.4 percentage-point leap in a single subgroup, in a single year, does not happen through gradual demographic change. For context, white students took 14 years to drop 15.1 percentage points in Rhode Island. The economically disadvantaged category covered nearly the same ground in one.
72,517 students — more than half the state's public school enrollment — are now classified as economically disadvantaged.
The year-over-year pattern reinforces the anomaly. Prior to 2024-25, the share moved in small increments. Then it lurched upward. Then it held. The 2025-26 count actually declined by 1,287 students from the prior year, but overall enrollment fell too, keeping the share pinned near 54%.
| Metric | Value |
|---|---|
| Econ-disadv count, 2025-26 | 72,517 |
| Econ-disadv share, 2025-26 | 54.2% |
| Econ-disadv share, 2023-24 | 43.9% |
| Econ-disadv share, 2024-25 | 54.3% |
| One-year share change (2023-24 to 2024-25) | +10.4 percentage points |
| One-year count change (2023-24 to 2024-25) | +14,091 |
| One-year count change (2024-25 to 2025-26) | -1,287 |
Real hardship or reclassification?
Two very different explanations fit the same data, and the enrollment files alone cannot distinguish between them.
The first possibility: Rhode Island families genuinely became poorer, and districts identified more students who qualified. The state's cost of living has climbed sharply, and federal pandemic-era relief programs expired in stages through 2023 and 2024. If thousands of families crossed eligibility thresholds in the same year, the count would jump.
The second possibility: the state or its districts changed how they identify economically disadvantaged students — broadening the definition, switching data sources for income verification, or adopting Community Eligibility Provision status at more schools. Any of these could reclassify existing students without a single family's circumstances changing.
The shape of the data — a sharp break followed by a plateau — is more consistent with a classification change than with gradual economic deterioration. But "more consistent" is not proof. The dataset does not include metadata on eligibility-rule or reporting-definition changes that could resolve the question.
What this means for schools
The distinction matters because it determines what kind of pressure districts face. If the higher share reflects real economic conditions, schools are serving a materially needier student body and may require expanded support services — more Title I programming, more free meal provision, more counseling staff. The one-in-five special education rate and one-in-six English learner share overlap significantly with economically disadvantaged students, compounding the resource demands.
If the jump is partly methodological, the immediate resource needs may not have changed as dramatically as the numbers suggest. But the planning risk shifts in a different direction: budget models and funding formulas built on the new baseline would be calibrated to a break in the data series rather than a break in reality.
Four things we cannot answer from this file
The enrollment data shows the what but not the why. From this file alone, we cannot determine:
- How much of the jump reflects true population change versus administrative reclassification.
- Whether any districts changed their identification process or eligibility criteria in 2024-25.
- Whether data-collection or reporting-timing effects played a role.
- How the economically disadvantaged count interacts with the state's separate free-and-reduced-lunch data.
Rhode Island's enrollment data has been under scrutiny for exactly this kind of ambiguity. A discrepancy between October 2024 counts and March 2025 updates threw off state funding estimates by $24 million, with errors concentrated in English learner and economically disadvantaged tallies. Until the state clarifies what changed in 2024-25, the 54% figure will carry an asterisk — accurate as reported, uncertain in meaning.
Detailed code that reproduces the analysis and figures in this article is available exclusively to EdTribune subscribers.
Discussion
Sign in to join the discussion.
Loading comments...