In this series: Rhode Island 2025-26 Enrollment.
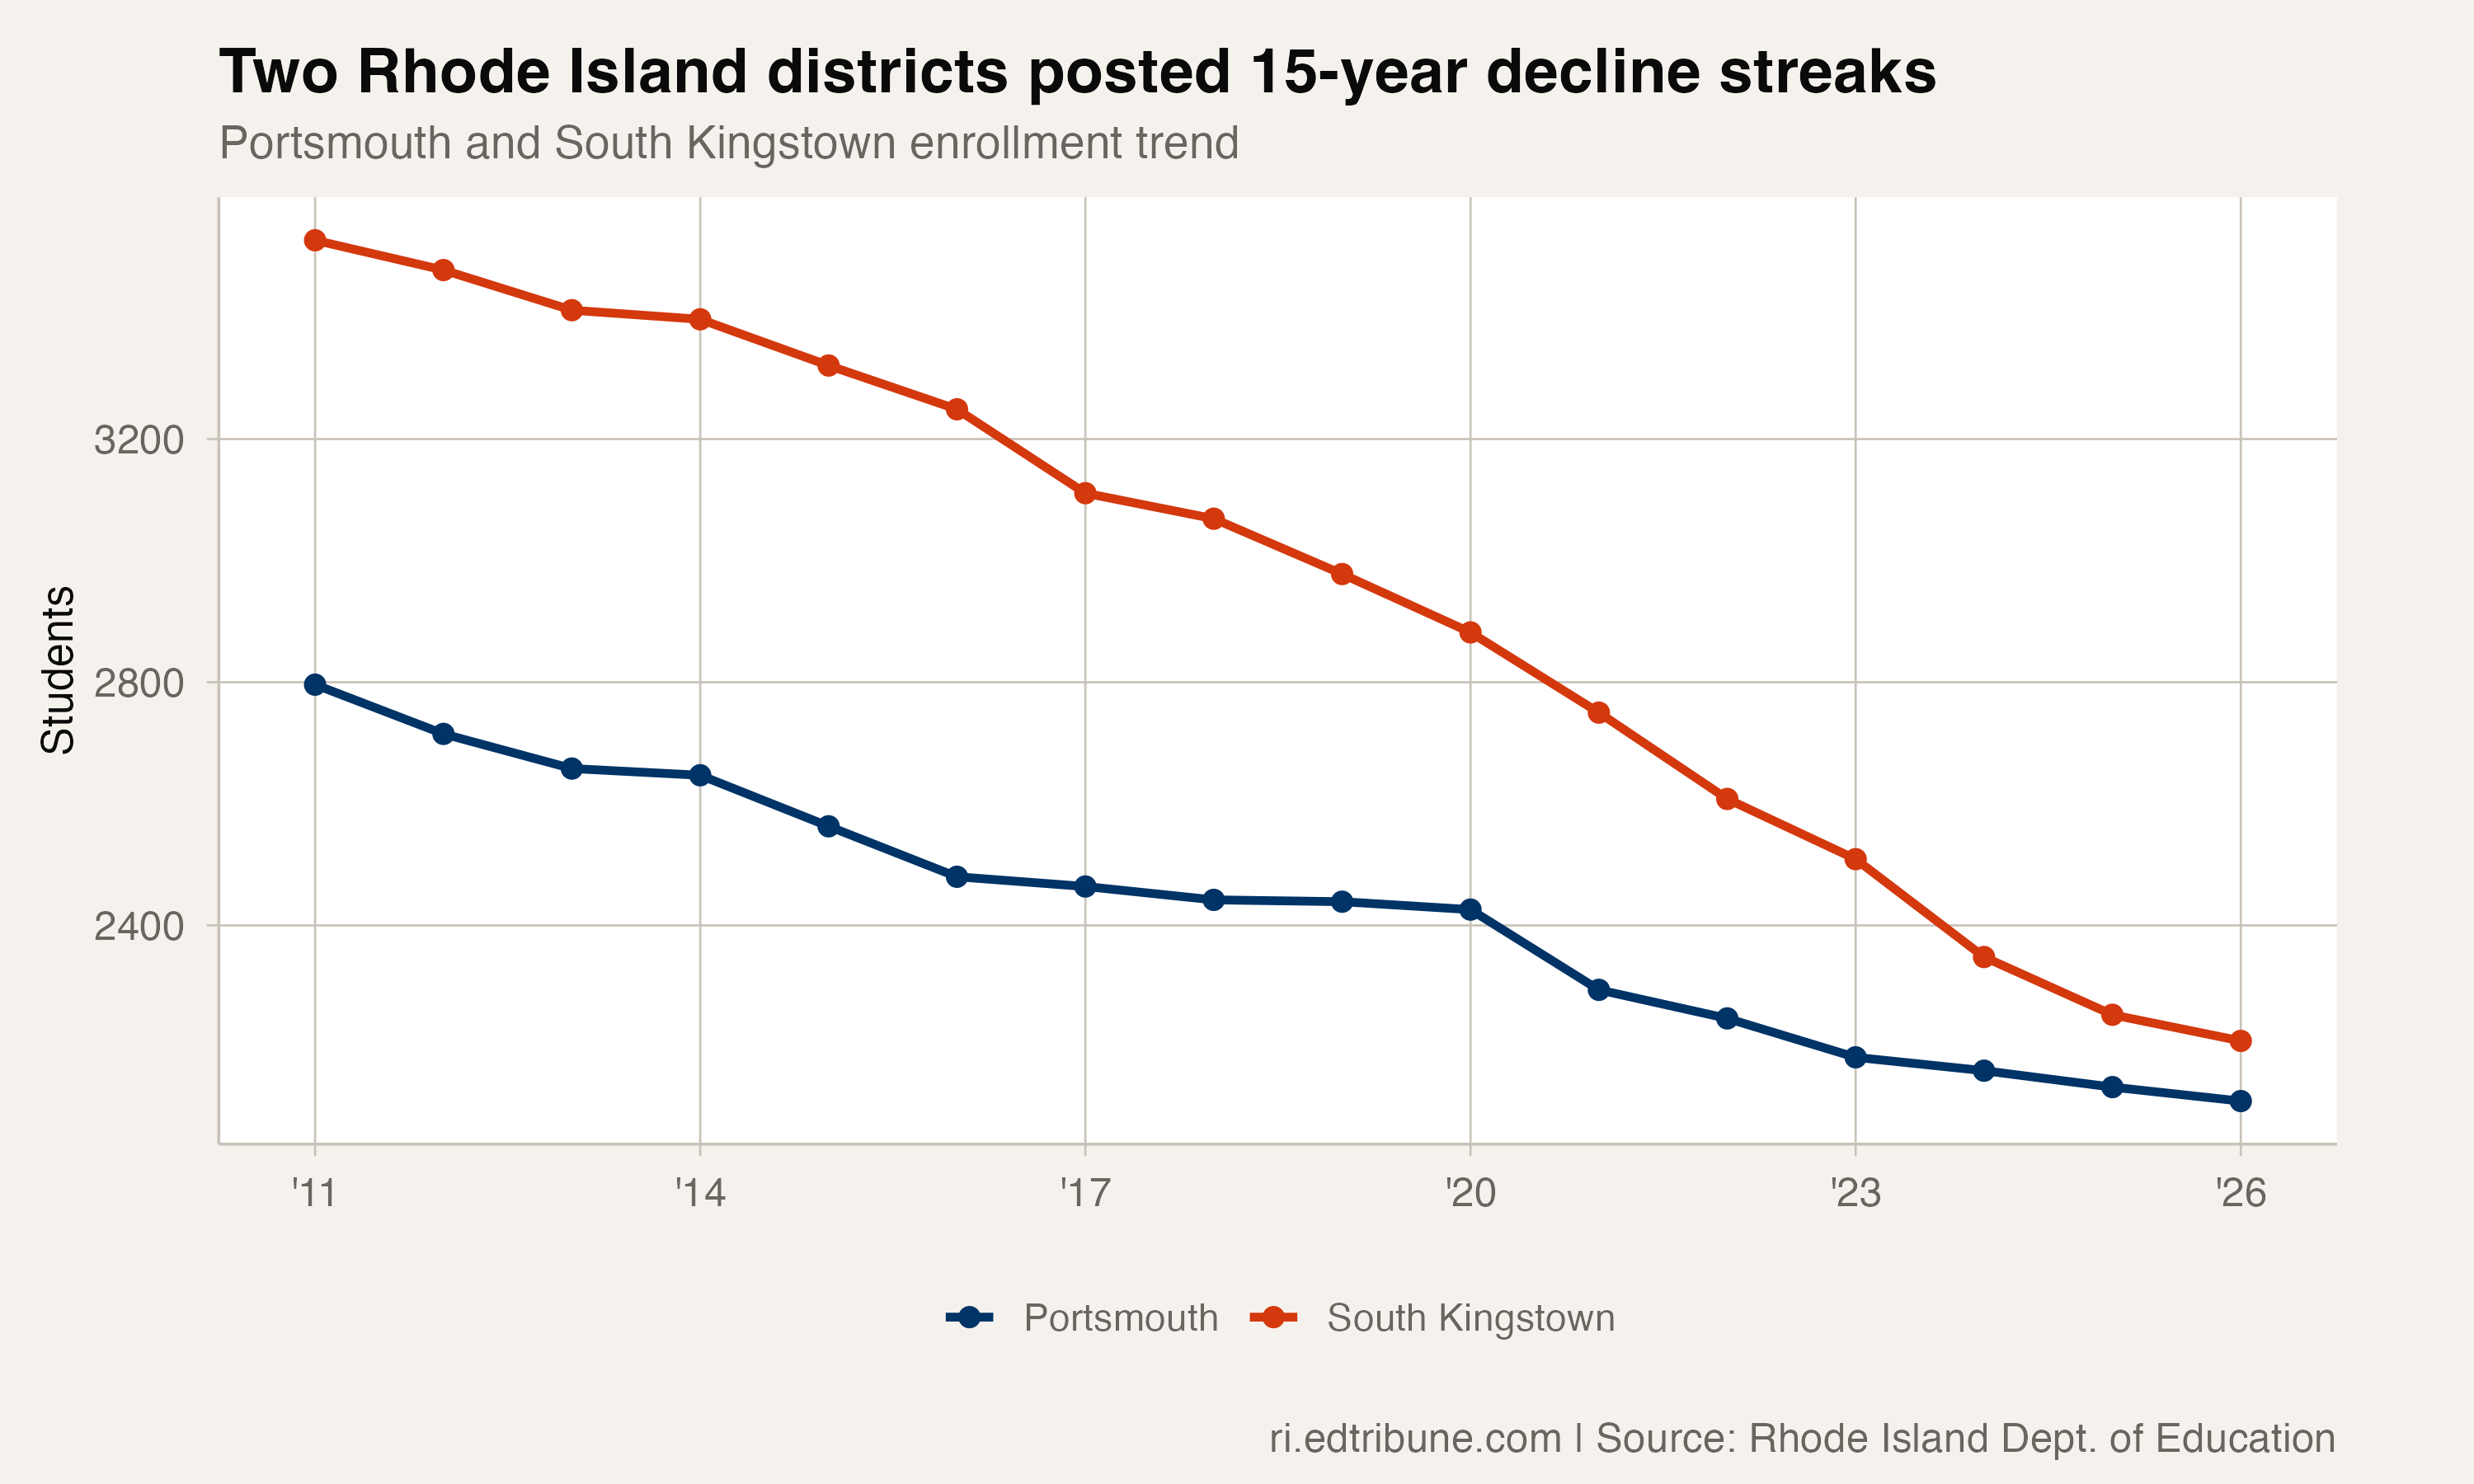
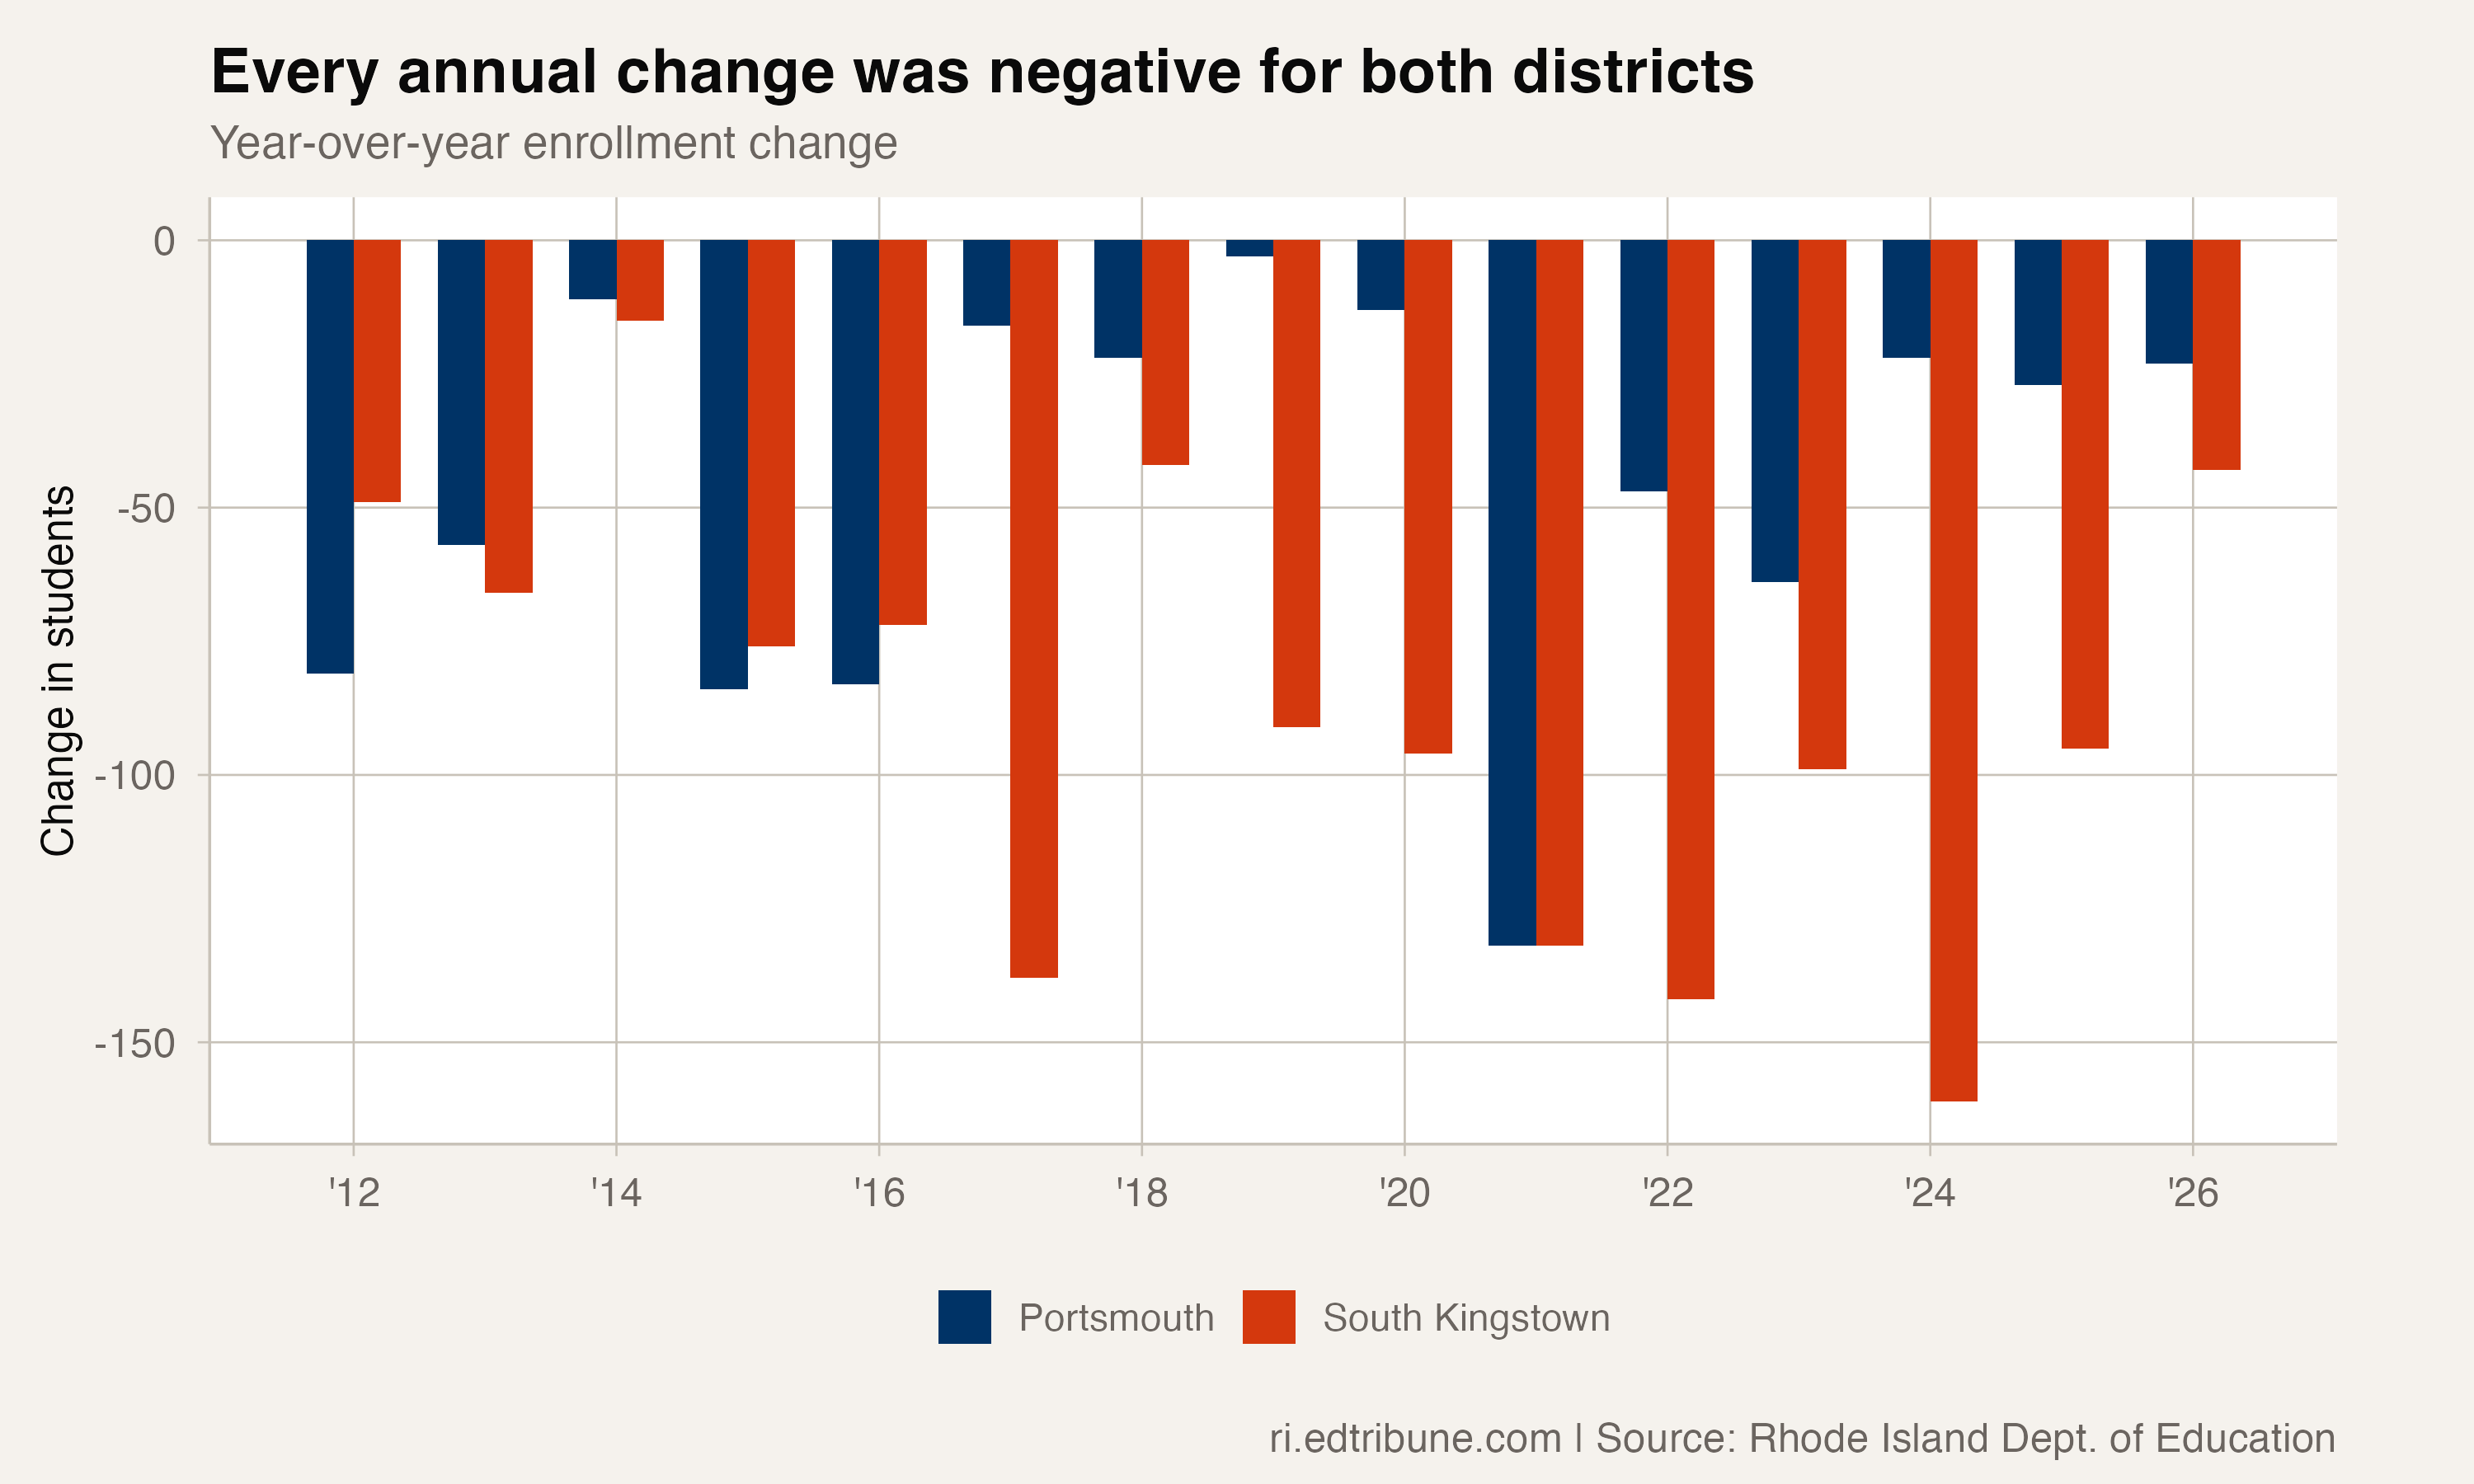
No Rhode Island district has declined longer than Portsmouth and South Kingstown. Both posted 15 consecutive years of enrollment loss from 2011-12 through 2025-26 — every single year, without exception.
That kind of streak is not a blip. It is not a COVID artifact. It predates the pandemic by nearly a decade, and it kept going right through it.
Fifteen years, no exceptions
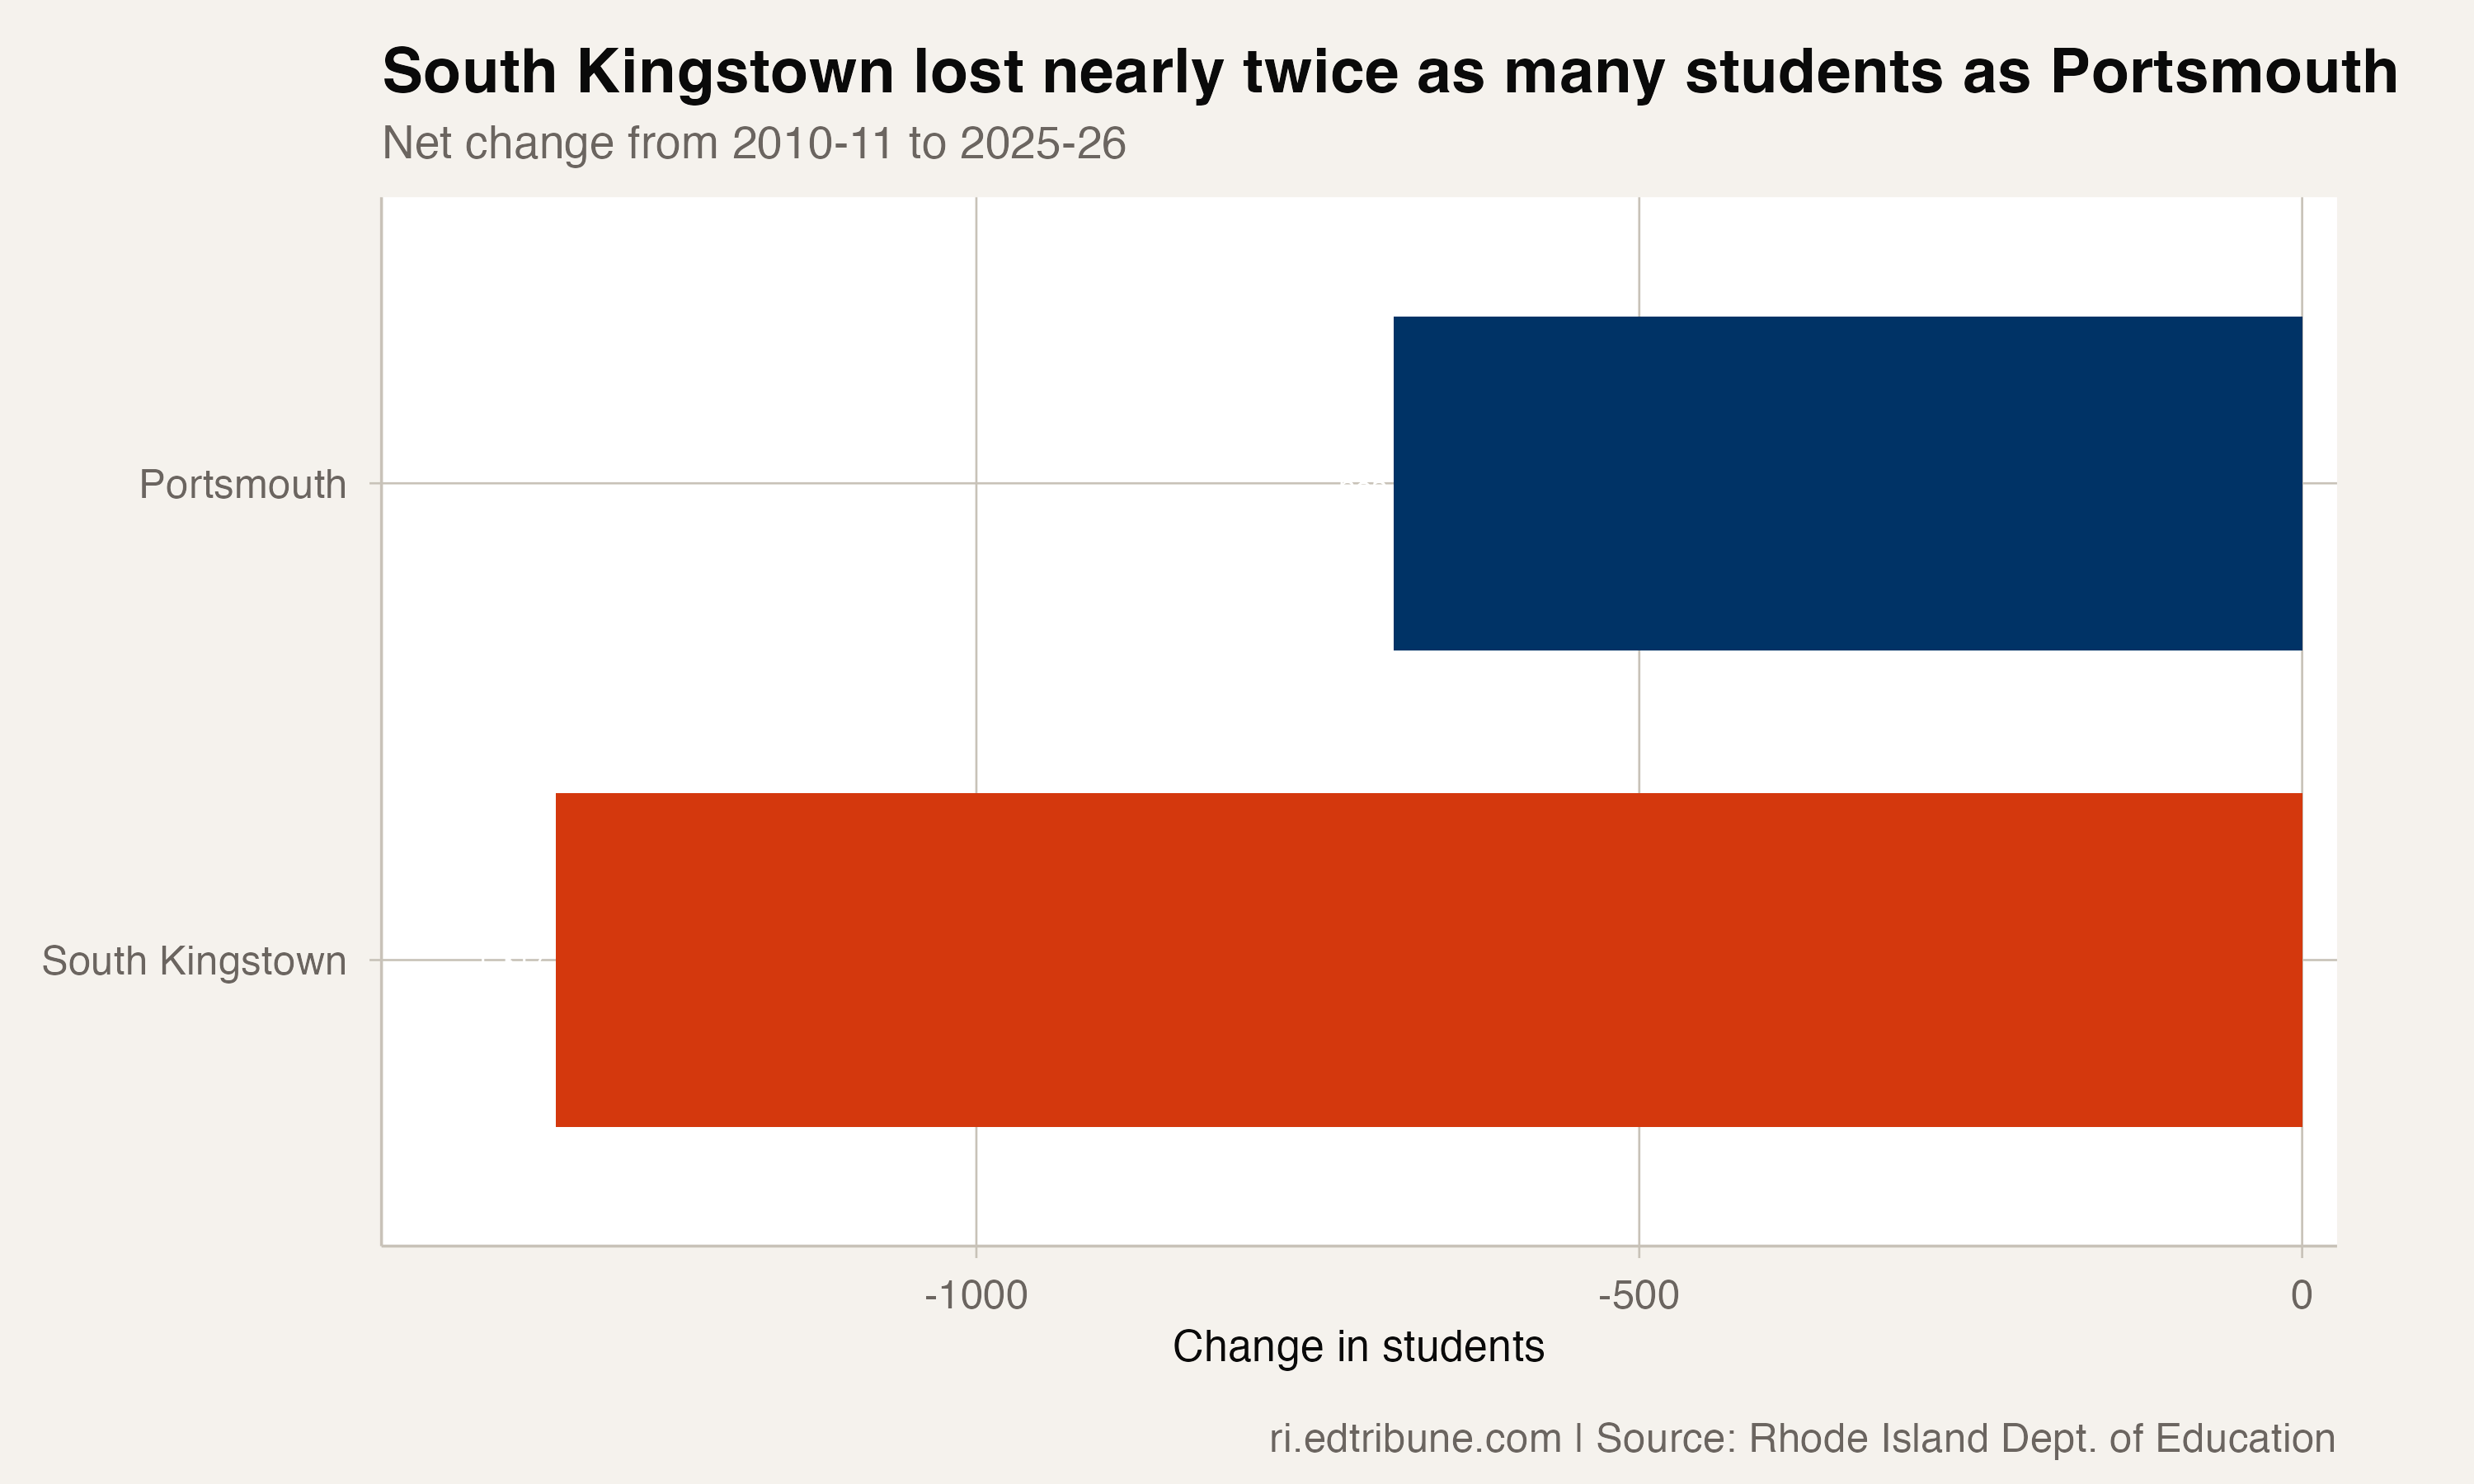
Portsmouth fell from 2,796 students in 2010-11 to 2,111 in 2025-26 — a loss of 685 students, or 24.5%. South Kingstown’s drop was steeper: from 3,527 to 2,210, shedding 1,317 students and 37.3% of its enrollment. Together, the two districts lost more than 2,000 students in a decade and a half.
South Kingstown lost more than a third of its students over 15 years. Portsmouth lost nearly a quarter.
| District | 2010-11 | 2025-26 | Change | % change | Consecutive annual declines |
|---|---|---|---|---|---|
| Portsmouth | 2,796 | 2,111 | -685 | -24.5% | 15 |
| South Kingstown | 3,527 | 2,210 | -1,317 | -37.3% | 15 |
Both districts now enroll fewer than 2,500 students, placing them among the half of Rhode Island districts that have slipped below 1,000 or hover near that threshold. Their declines also feed into the state’s broader pattern: Rhode Island has recorded six consecutive years of statewide enrollment decline, and the latest snapshot shows 22 districts sitting at historic lows compared to just 16 at highs.
Same streak length, different stories
Fifteen years is fifteen years, but the trajectories are not identical. South Kingstown’s percentage loss is roughly 50% larger than Portsmouth’s. Whether that gap reflects different birth-rate trajectories, different rates of out-migration, or different levels of competition from charter and private schools is impossible to say from enrollment data alone.
The enrollment file does not include local birth trends, migration by age cohort, or housing turnover. Similar streak lengths can mask very different local mechanisms — and untangling those mechanisms would require reporting that goes well beyond the numbers.
What the data does tell us: the streaks are structural, not episodic. A district that declines for 15 straight years is not experiencing a rough patch. It is experiencing a new baseline.
What shrinking this long means for a district
A 15-year decline reshapes how a district operates. Sustained enrollment loss puts pressure on per-pupil funding formulas, forces difficult conversations about school consolidation and staffing ratios, and narrows the range of programs a district can offer. Facility utilization drops. Fixed costs get spread across fewer families.
Neither district has shown any sign of stabilizing. If the 2026-27 numbers continue the pattern, both will reach 16 consecutive years of decline — a streak that would span an entire K-12 career. Whether state-level policy, local housing shifts, or something else breaks the cycle remains an open question.
Detailed code that reproduces the analysis and figures in this article is available exclusively to EdTribune subscribers.
Discussion
Sign in to join the discussion.
Loading comments...