In the suburban Rhode Island district of Barrington↗ET, 7.64% of students were chronically absent in the 2023-24 school year. Thirty miles north in Woonsocket↗ET, the figure was 44.13%.
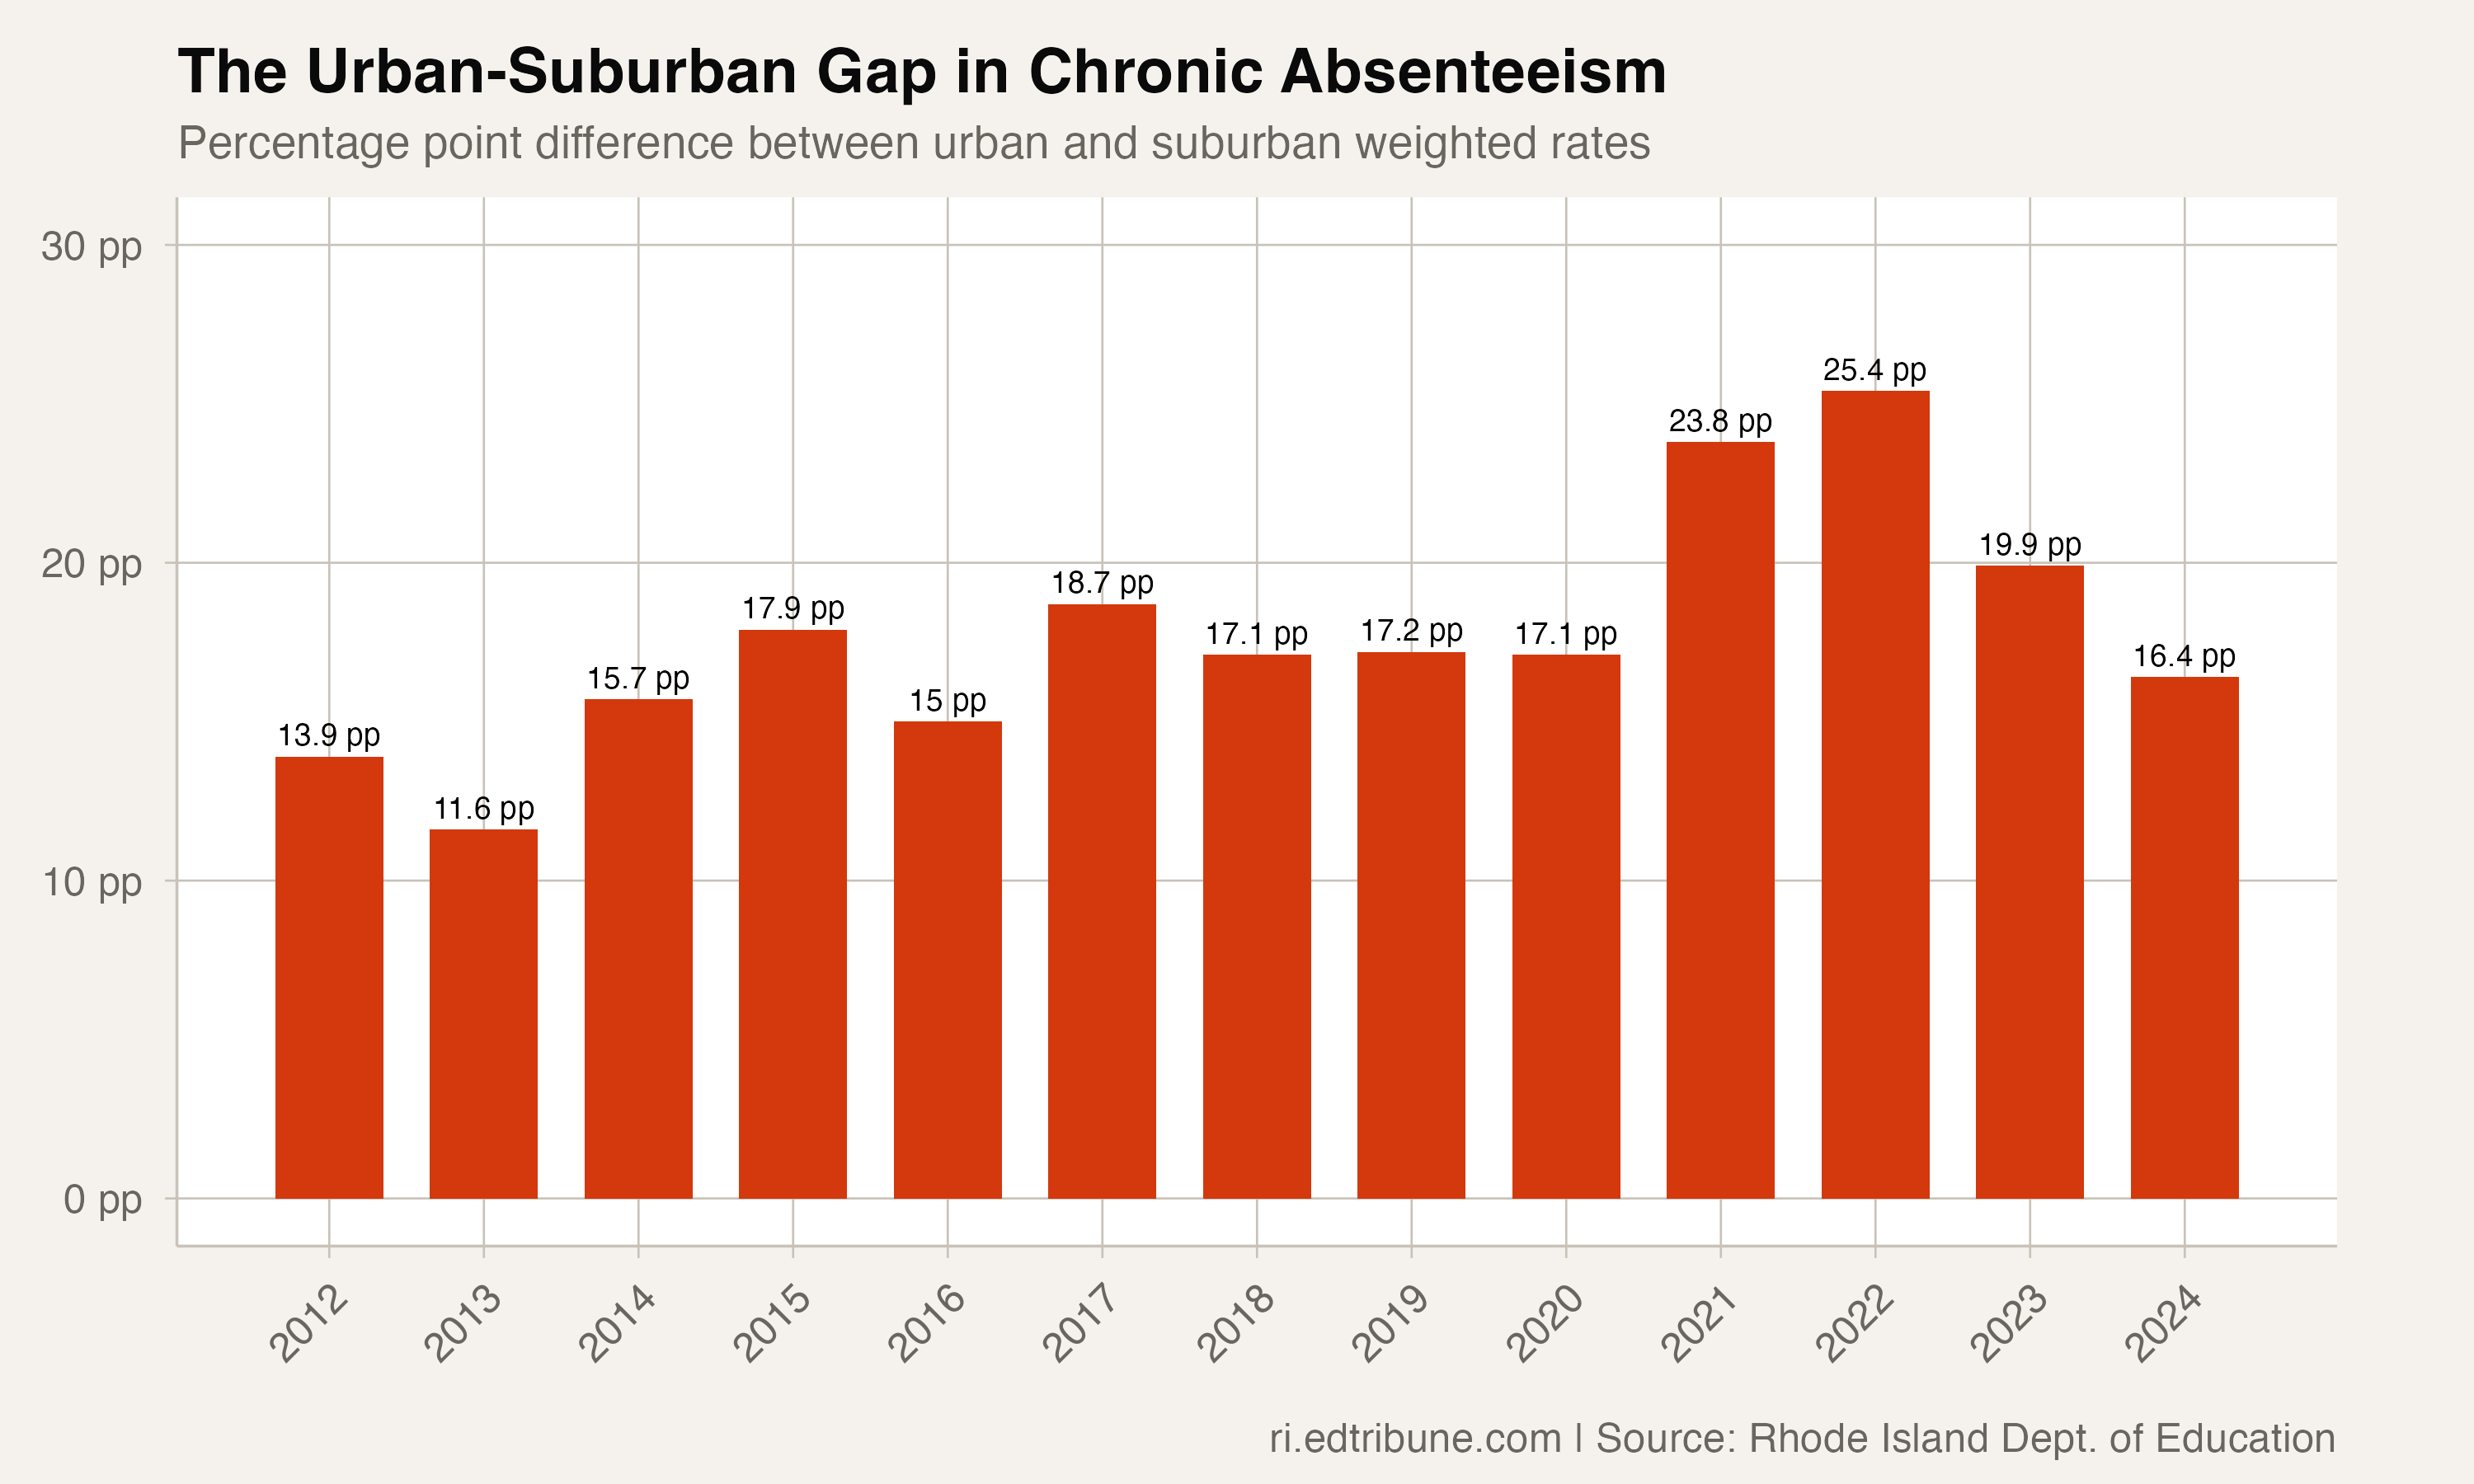
The two districts sit at opposite ends of a divide that runs through nearly every measure of Rhode Island education, but chronic absenteeism makes it especially stark. Across the state's six major urban districts, the weighted chronic absenteeism rate is 32.0%. Across 15 suburban districts, it is 15.6%. The 16.4 percentage point gap means that urban students are roughly twice as likely to miss 10% or more of school days.
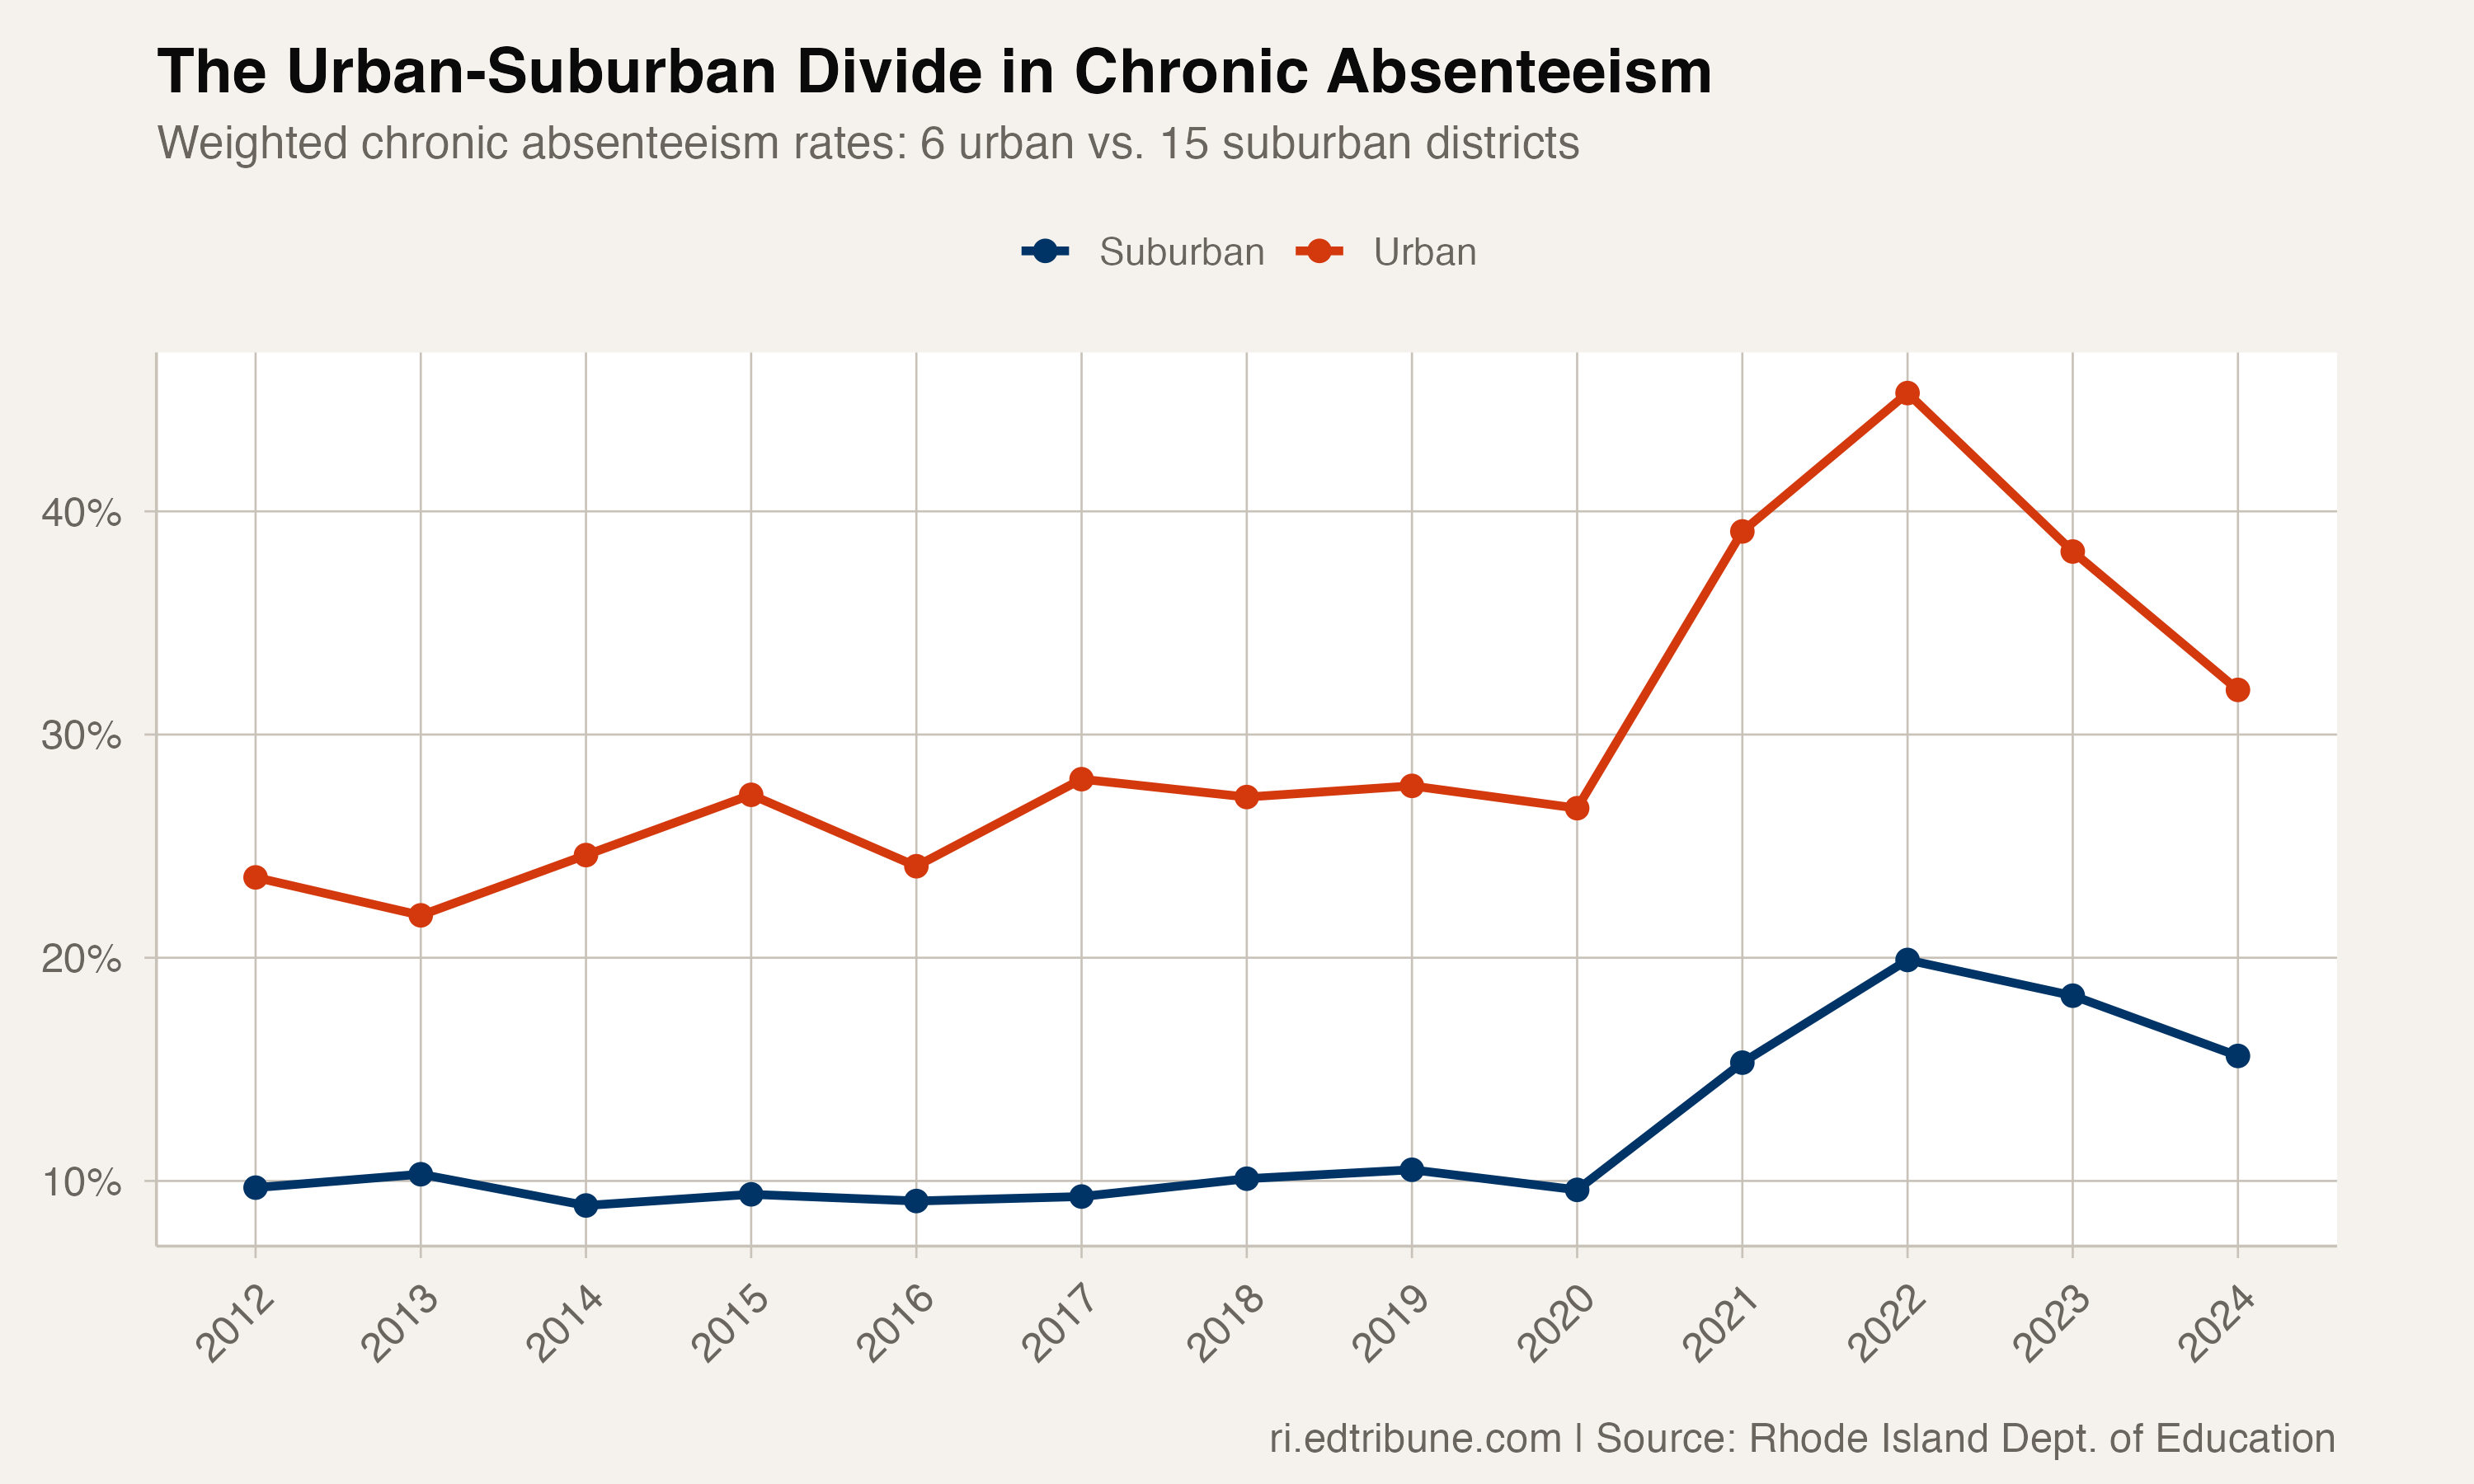
COVID widened the gap, then partially reversed
The urban-suburban gap was already substantial before the pandemic. In 2018-19, urban districts posted a weighted rate of 27.7% against 10.5% in the suburbs, a 17.2 point spread. COVID detonated both numbers, but urban districts absorbed the larger shock. By 2021-22, the urban rate hit 45.3% while suburban districts reached 19.9%, stretching the gap to its widest recorded point of 25.4 percentage points.
The recovery has been asymmetric in an unexpected direction: urban districts have improved faster. The urban rate dropped 13.3 points from peak, compared to 4.3 points in the suburbs. This narrowed the gap from 25.4 to 16.4 points, slightly below the pre-COVID gap of 17.2.
But the narrowing is partly an artifact of Providence's extraordinary turnaround. Providence, which enrolls more students than the other five urban districts combined, drove its rate from 57.06% to 36.37%. Remove Providence from the urban calculation and the remaining five cities show far less improvement.
Within urban, a wide range
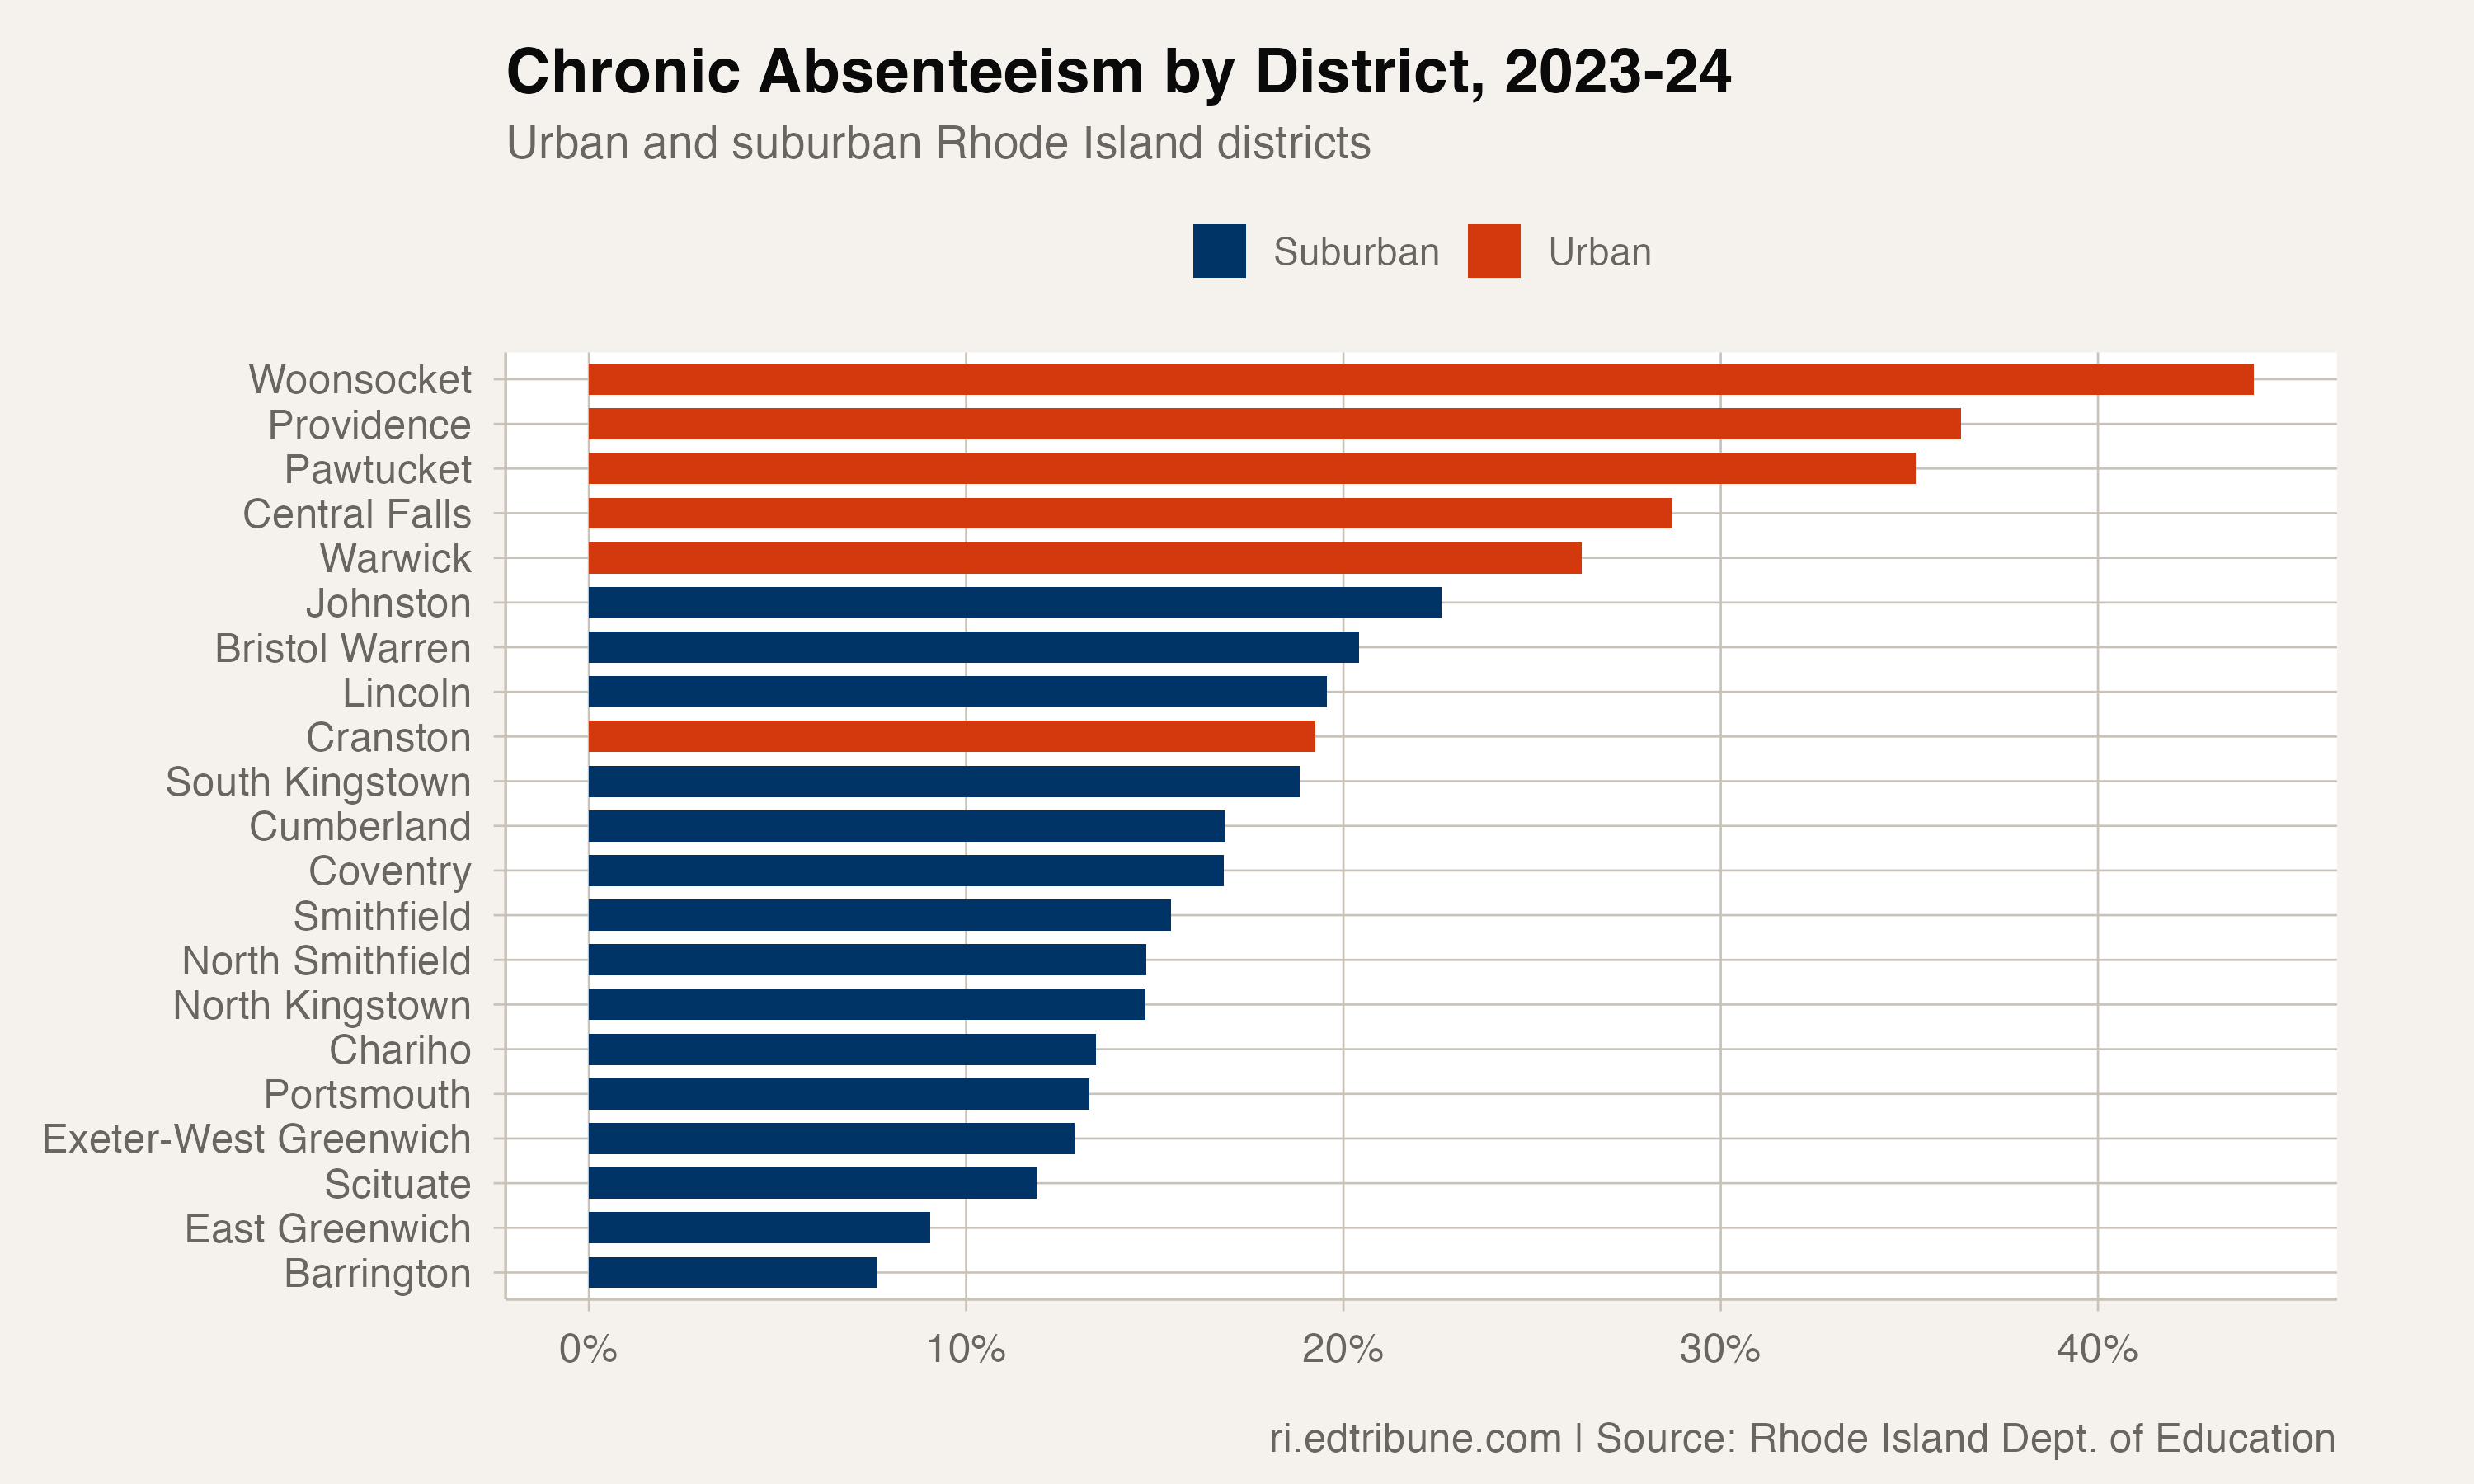
The 32.0% weighted urban rate obscures enormous variation among the six cities themselves. Cranston↗ET, the state's second-largest district, posts a 19.26% chronic absenteeism rate, below the statewide average of 24.76% and closer to suburban norms. Warwick↗ET sits at 26.31%, moderately above the state rate.
Then there are the districts where chronic absenteeism is not a crisis to manage but a defining condition. Woonsocket, at 44.13%, has more students chronically absent than present at normal attendance levels. Pawtucket↗ET, at 35.16%, has seen almost no improvement from its peak. Providence↗ET, at 36.37%, is the outlier success story: the only one of the six to recover below its pre-COVID rate.
Central Falls↗ET, Rhode Island's smallest and poorest city, actually posts one of the more encouraging trajectories: down from 48.15% at peak to 28.72%, driven partly by school-level attendance liaisons that many other districts lack.
Suburban is not the same as low
The suburban category, too, is not monolithic. While Barrington (7.64%), East Greenwich↗ET (9.05%), and Cumberland↗ET (16.88%) anchor the low end, several suburban districts are approaching rates that would have qualified as urban-level problems a decade ago. Johnston↗ET, at 22.59%, sits above 20%, and Coventry↗ET, at 16.83%, trails close behind.
The pre-COVID suburban rate of 10.5% has proven difficult to recover. At 15.6%, suburban districts have recovered only about half the ground lost during COVID. The gap narrowed not because suburbs improved dramatically, but because urban districts improved more from a much worse starting point.
The resource question
Rhode Island funds schools on a per-pupil basis through Resident Average Daily Membership (enrollment, not attendance). A student who misses 30 days generates the same state aid as a student who misses zero. This means chronic absenteeism does not trigger automatic funding consequences the way it would in average-daily-attendance states like California or Texas.
The implication is that attendance improvement requires proactive investment, not just protection of existing resources. Central Falls, which has attendance liaisons in every school, has improved faster than Pawtucket, which relies on a smaller, more centralized attendance team. The resource disparity between urban and suburban districts maps onto the absenteeism gap in ways that are difficult to disentangle from demographics but impossible to ignore.
Detailed code that reproduces the analysis and figures in this article is available exclusively to EdTribune subscribers.
Discussion
Sign in to join the discussion.
Loading comments...