Rhode Island's published four-year graduation rate for the Career and Technical Education subgroup was 93.8 percent in 2024. The published rate for all students was 84.1 percent, a difference of 9.7 percentage points.
The CTE subgroup's dropout rate was 2.8 percent. The all-students rate was 7.7 percent. The CTE rate was less than half the all-students rate, but the subgroup comparison alone does not establish why the rates differed.
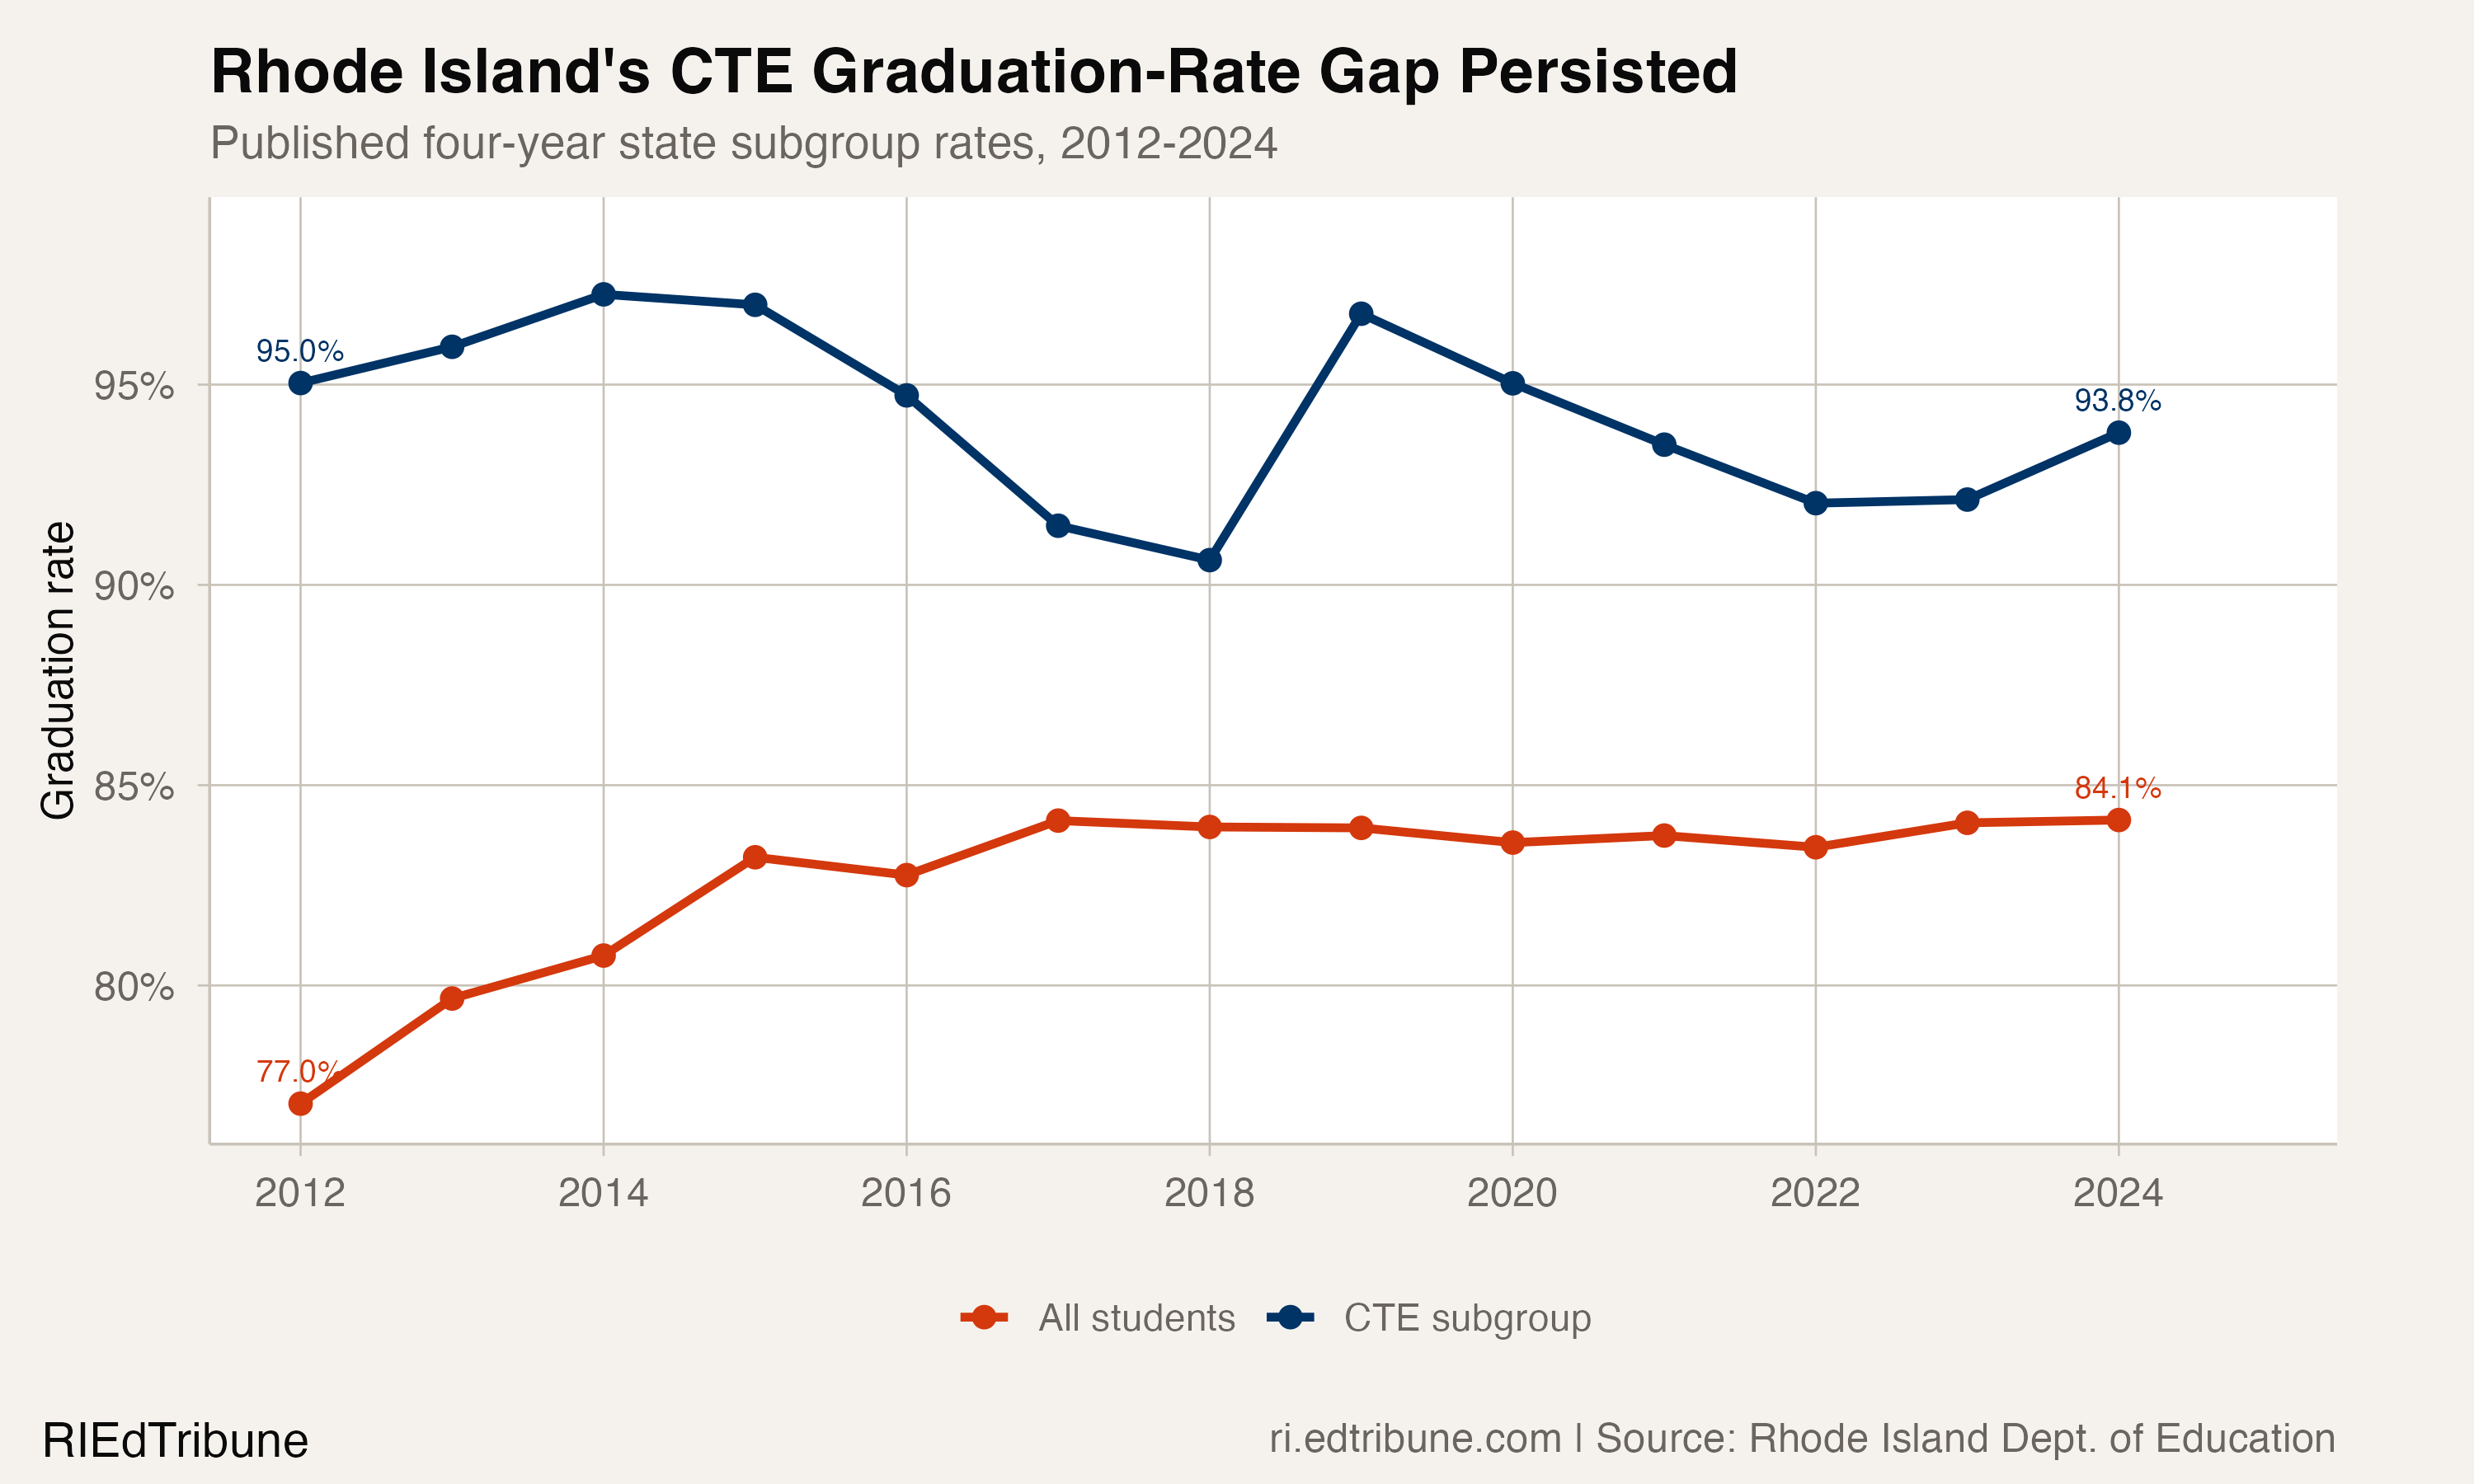
A positive gap in all 13 published years
Current RIDE graduation files provide a complete comparable state panel from 2012 through 2024. The analysis uses one published four-year state row per year for the CTE subgroup and one for all students.
The CTE graduation rate was higher in each of the 13 years. The gap ranged from 6.7 points in 2018 to 18.0 points in 2012. Its arithmetic average across the full panel was 11.6 points.
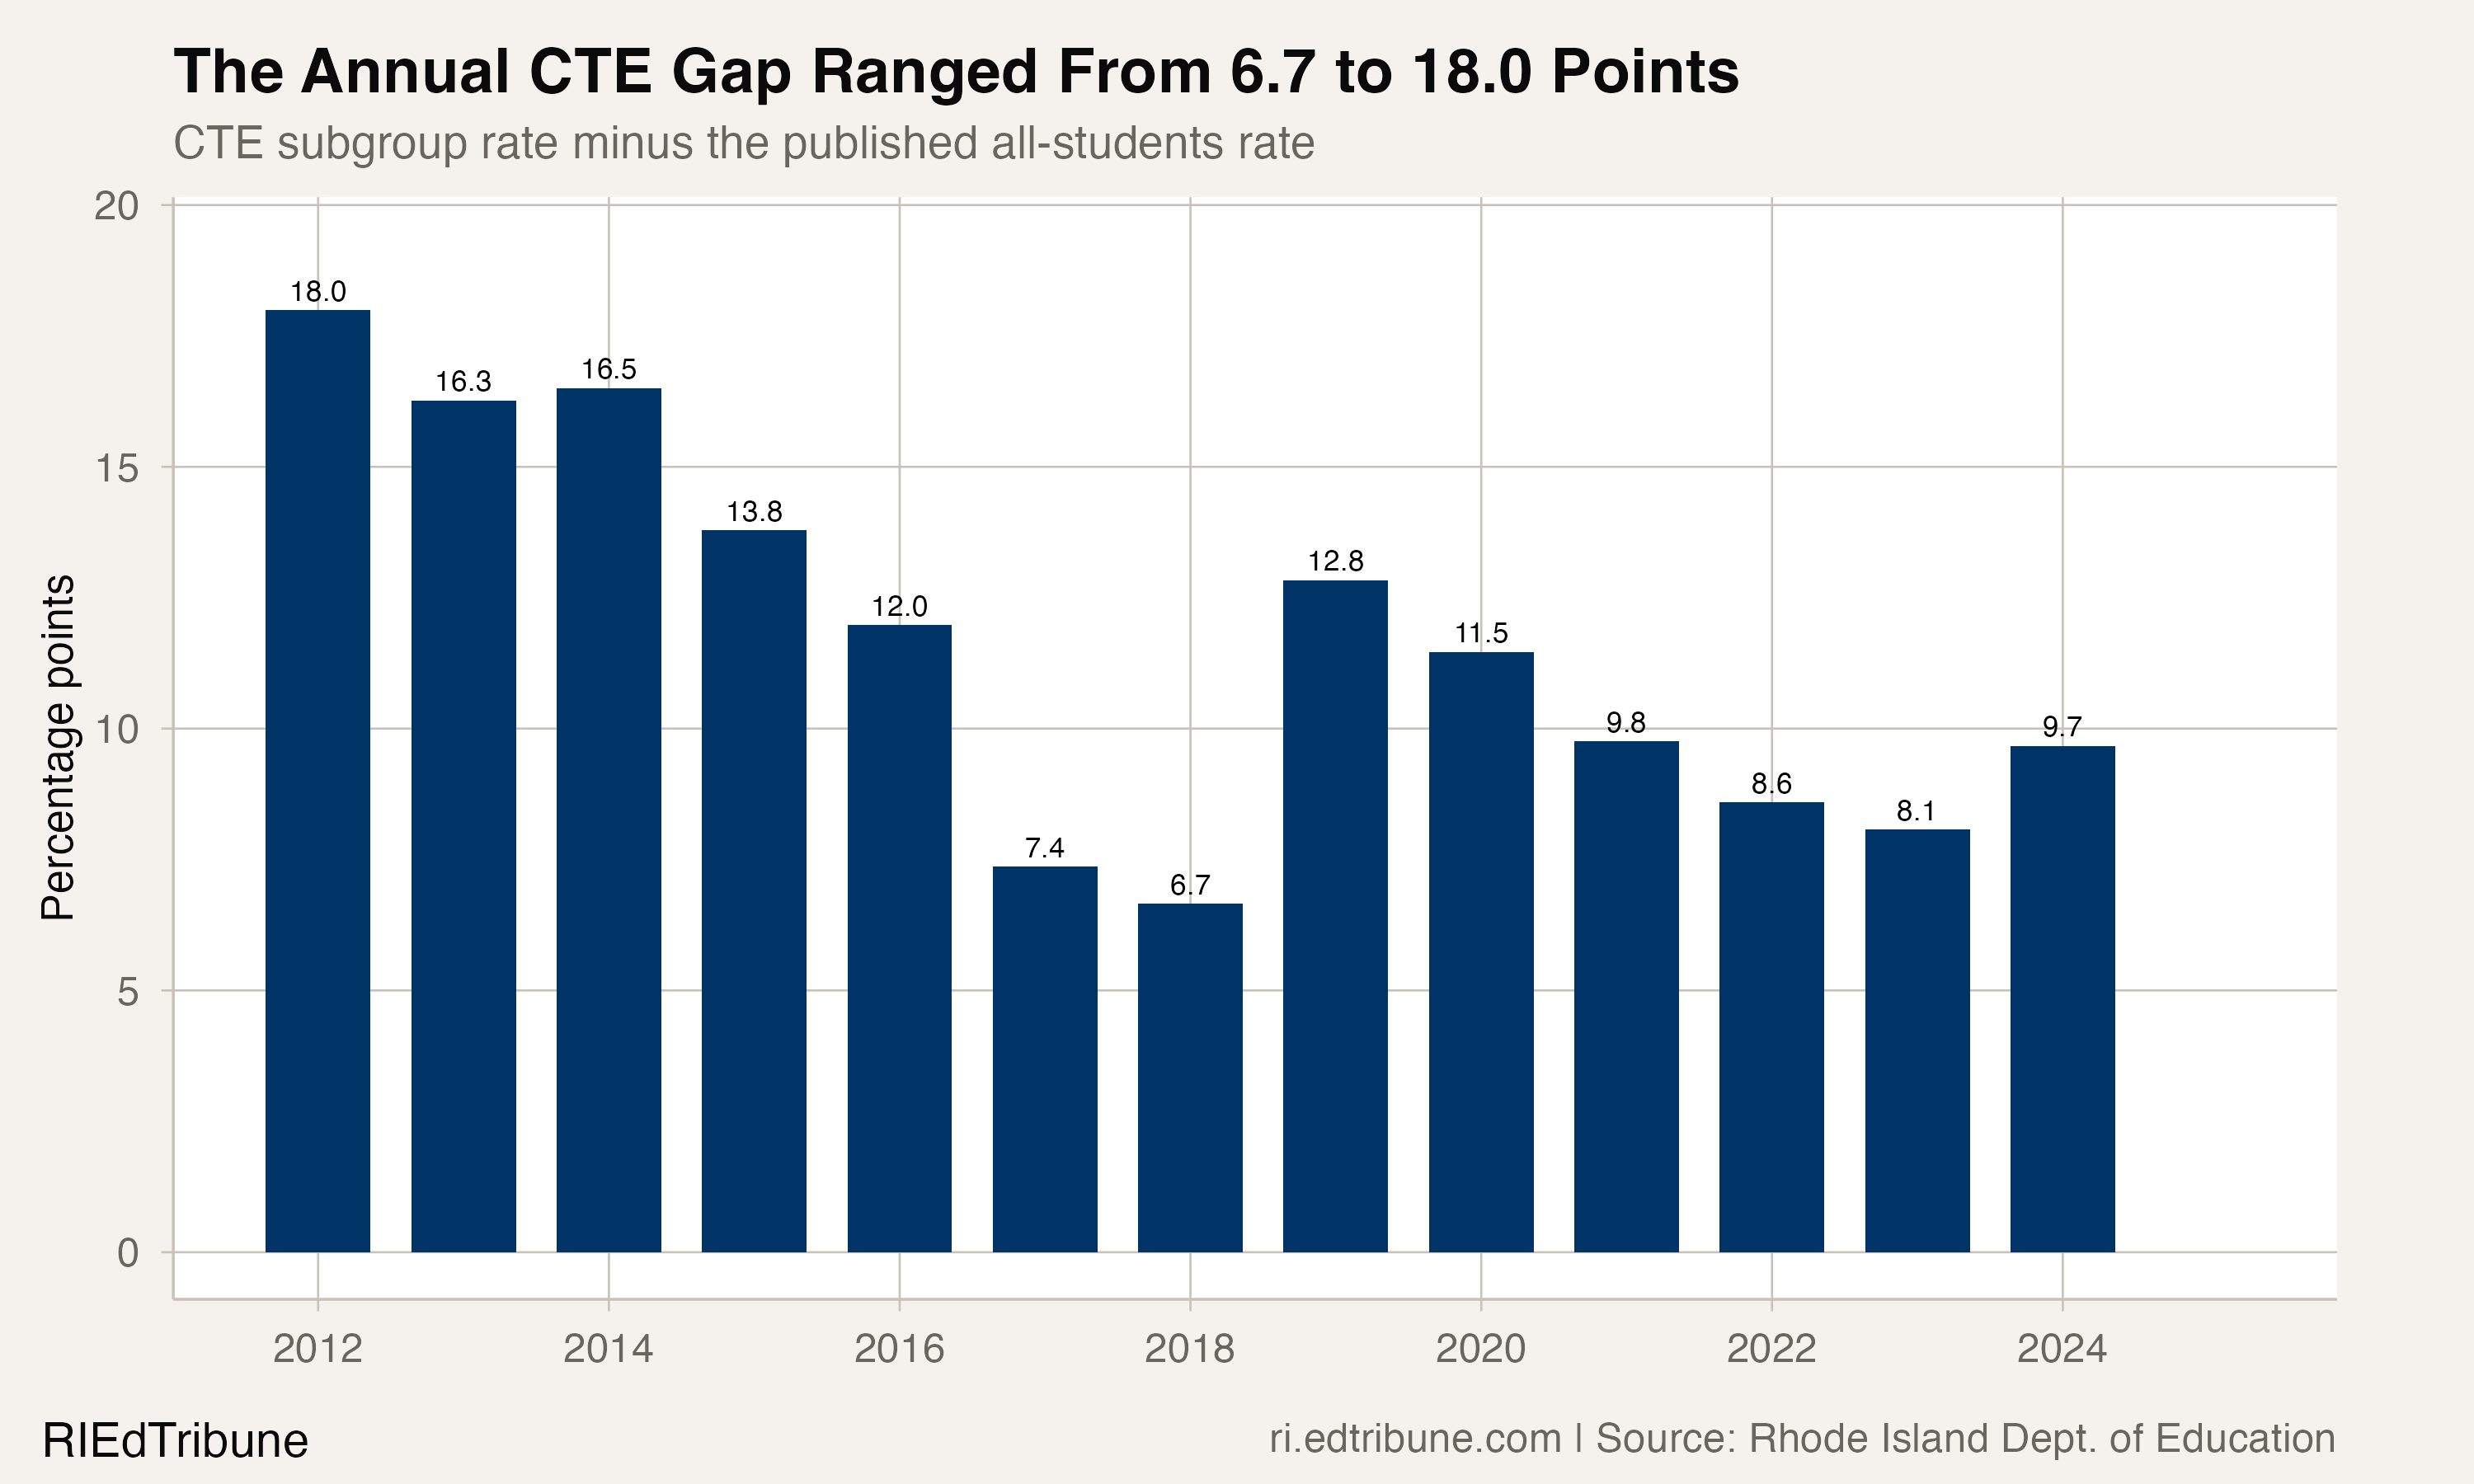
The endpoints show why the gap narrowed over the full period. The all-students rate rose from 77.0 percent in 2012 to 84.1 percent in 2024. The CTE subgroup rate moved from 95.0 percent to 93.8 percent. Those are descriptive changes in published subgroup rates, not evidence that one trend caused the other.
The denominator is the published statewide cohort
The 2024 CTE subgroup row reports 3,711 students in the four-year cohort. The statewide all-students row reports a cohort total of 10,966. Dividing the CTE count by that published statewide total gives 33.8 percent.
That is a share of the published four-year cohort, not a share of graduates. The CTE row reports 3,481 graduates, while the all-students row reports 9,226. The article does not build a denominator by adding subgroup rows or treat every cohort member as a graduate.
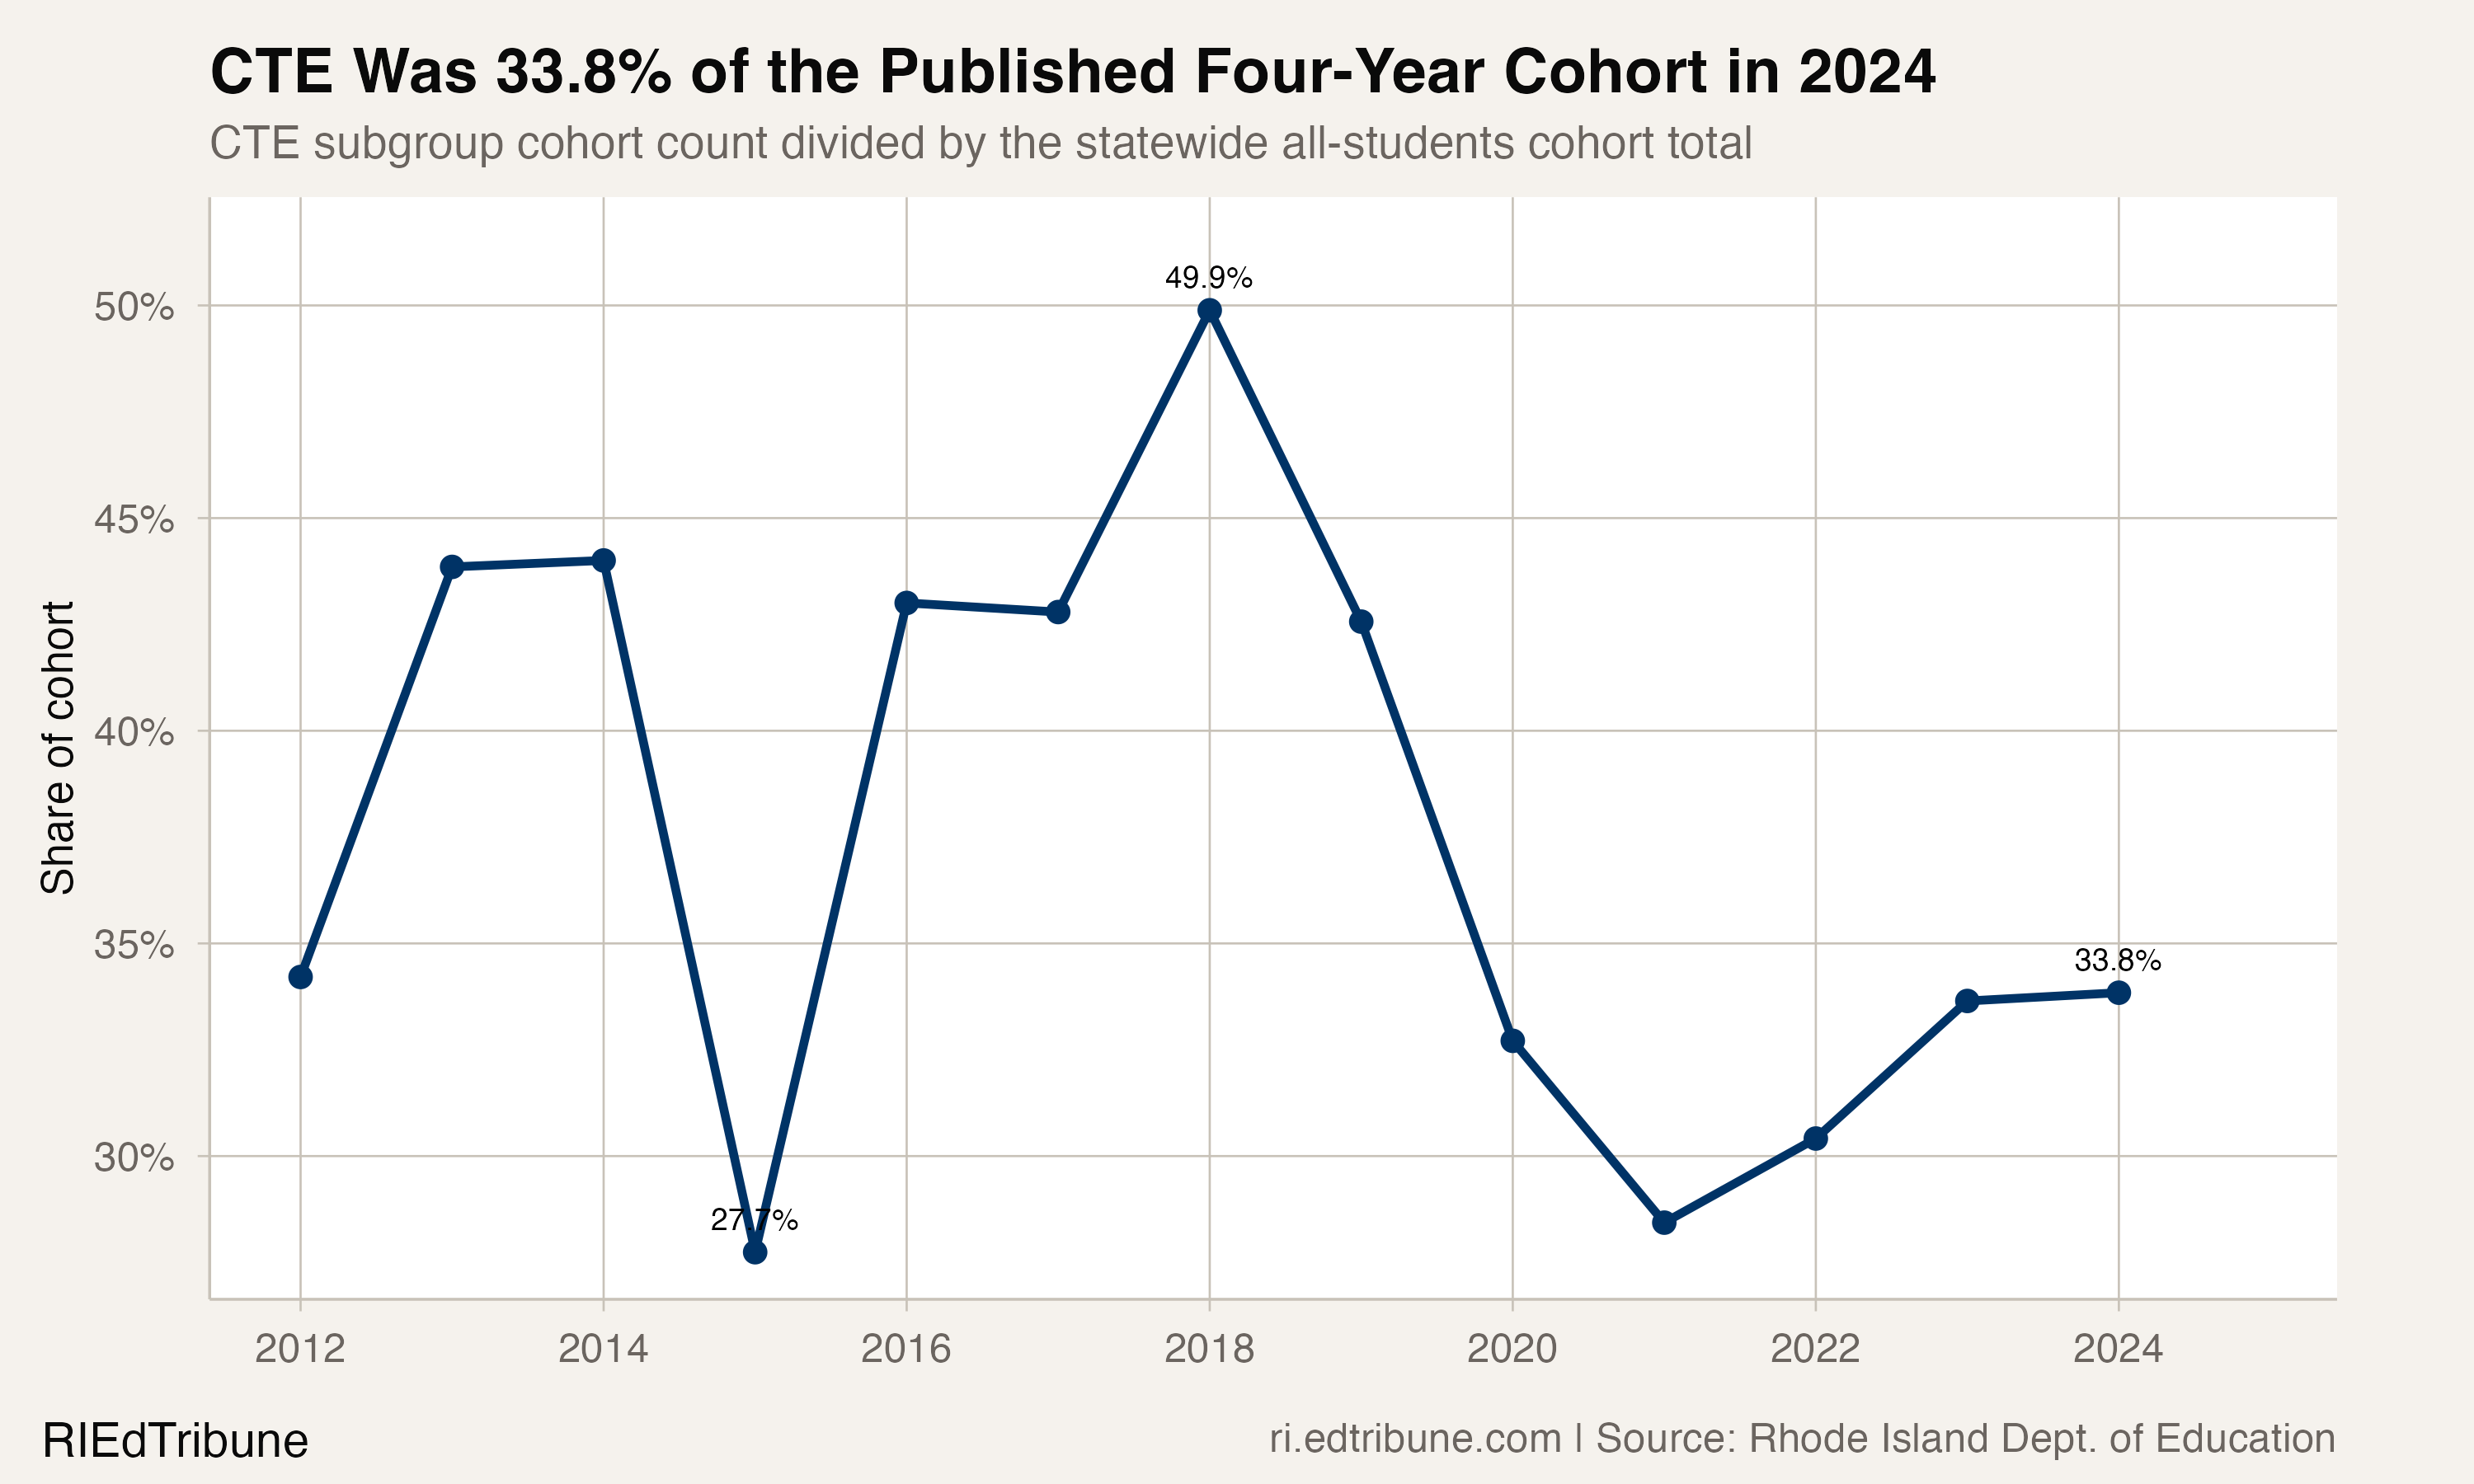
Across the 13-year panel, the published-total CTE cohort share ranged from 27.7 percent in 2015 to 49.9 percent in 2018. It was 33.8 percent in 2024. The graduation files establish those reported counts; they do not explain the changes in subgroup size.
What the comparison cannot establish
The CTE row is a subgroup within the statewide all-students row, not a randomized comparison group. The public graduation files do not isolate a program effect or show what the same students' outcomes would have been without CTE participation.
The data therefore supports a precise descriptive finding: Rhode Island's published CTE subgroup had a higher four-year graduation rate than the statewide all-students group in every year from 2012 through 2024. It does not support claims about student motivation, selection, program mechanisms, expansion policy, or future statewide graduation rates.
Detailed code that reproduces the analysis and figures in this article is available exclusively to EdTribune subscribers.
Discussion
Sign in to join the discussion.
Loading comments...