Rhode Island's five-year graduation rate for students receiving special education services was 70.8% in the 2024 file. That was 6.0 percentage points above the four-year rate of 64.8%. Statewide, the five-year rate was 86.3%, 2.2 points above the four-year rate of 84.1%.
The longer measure narrows the difference between the two groups. The statewide rate was 19.3 points higher under the four-year measure and 15.4 points higher under the five-year measure.
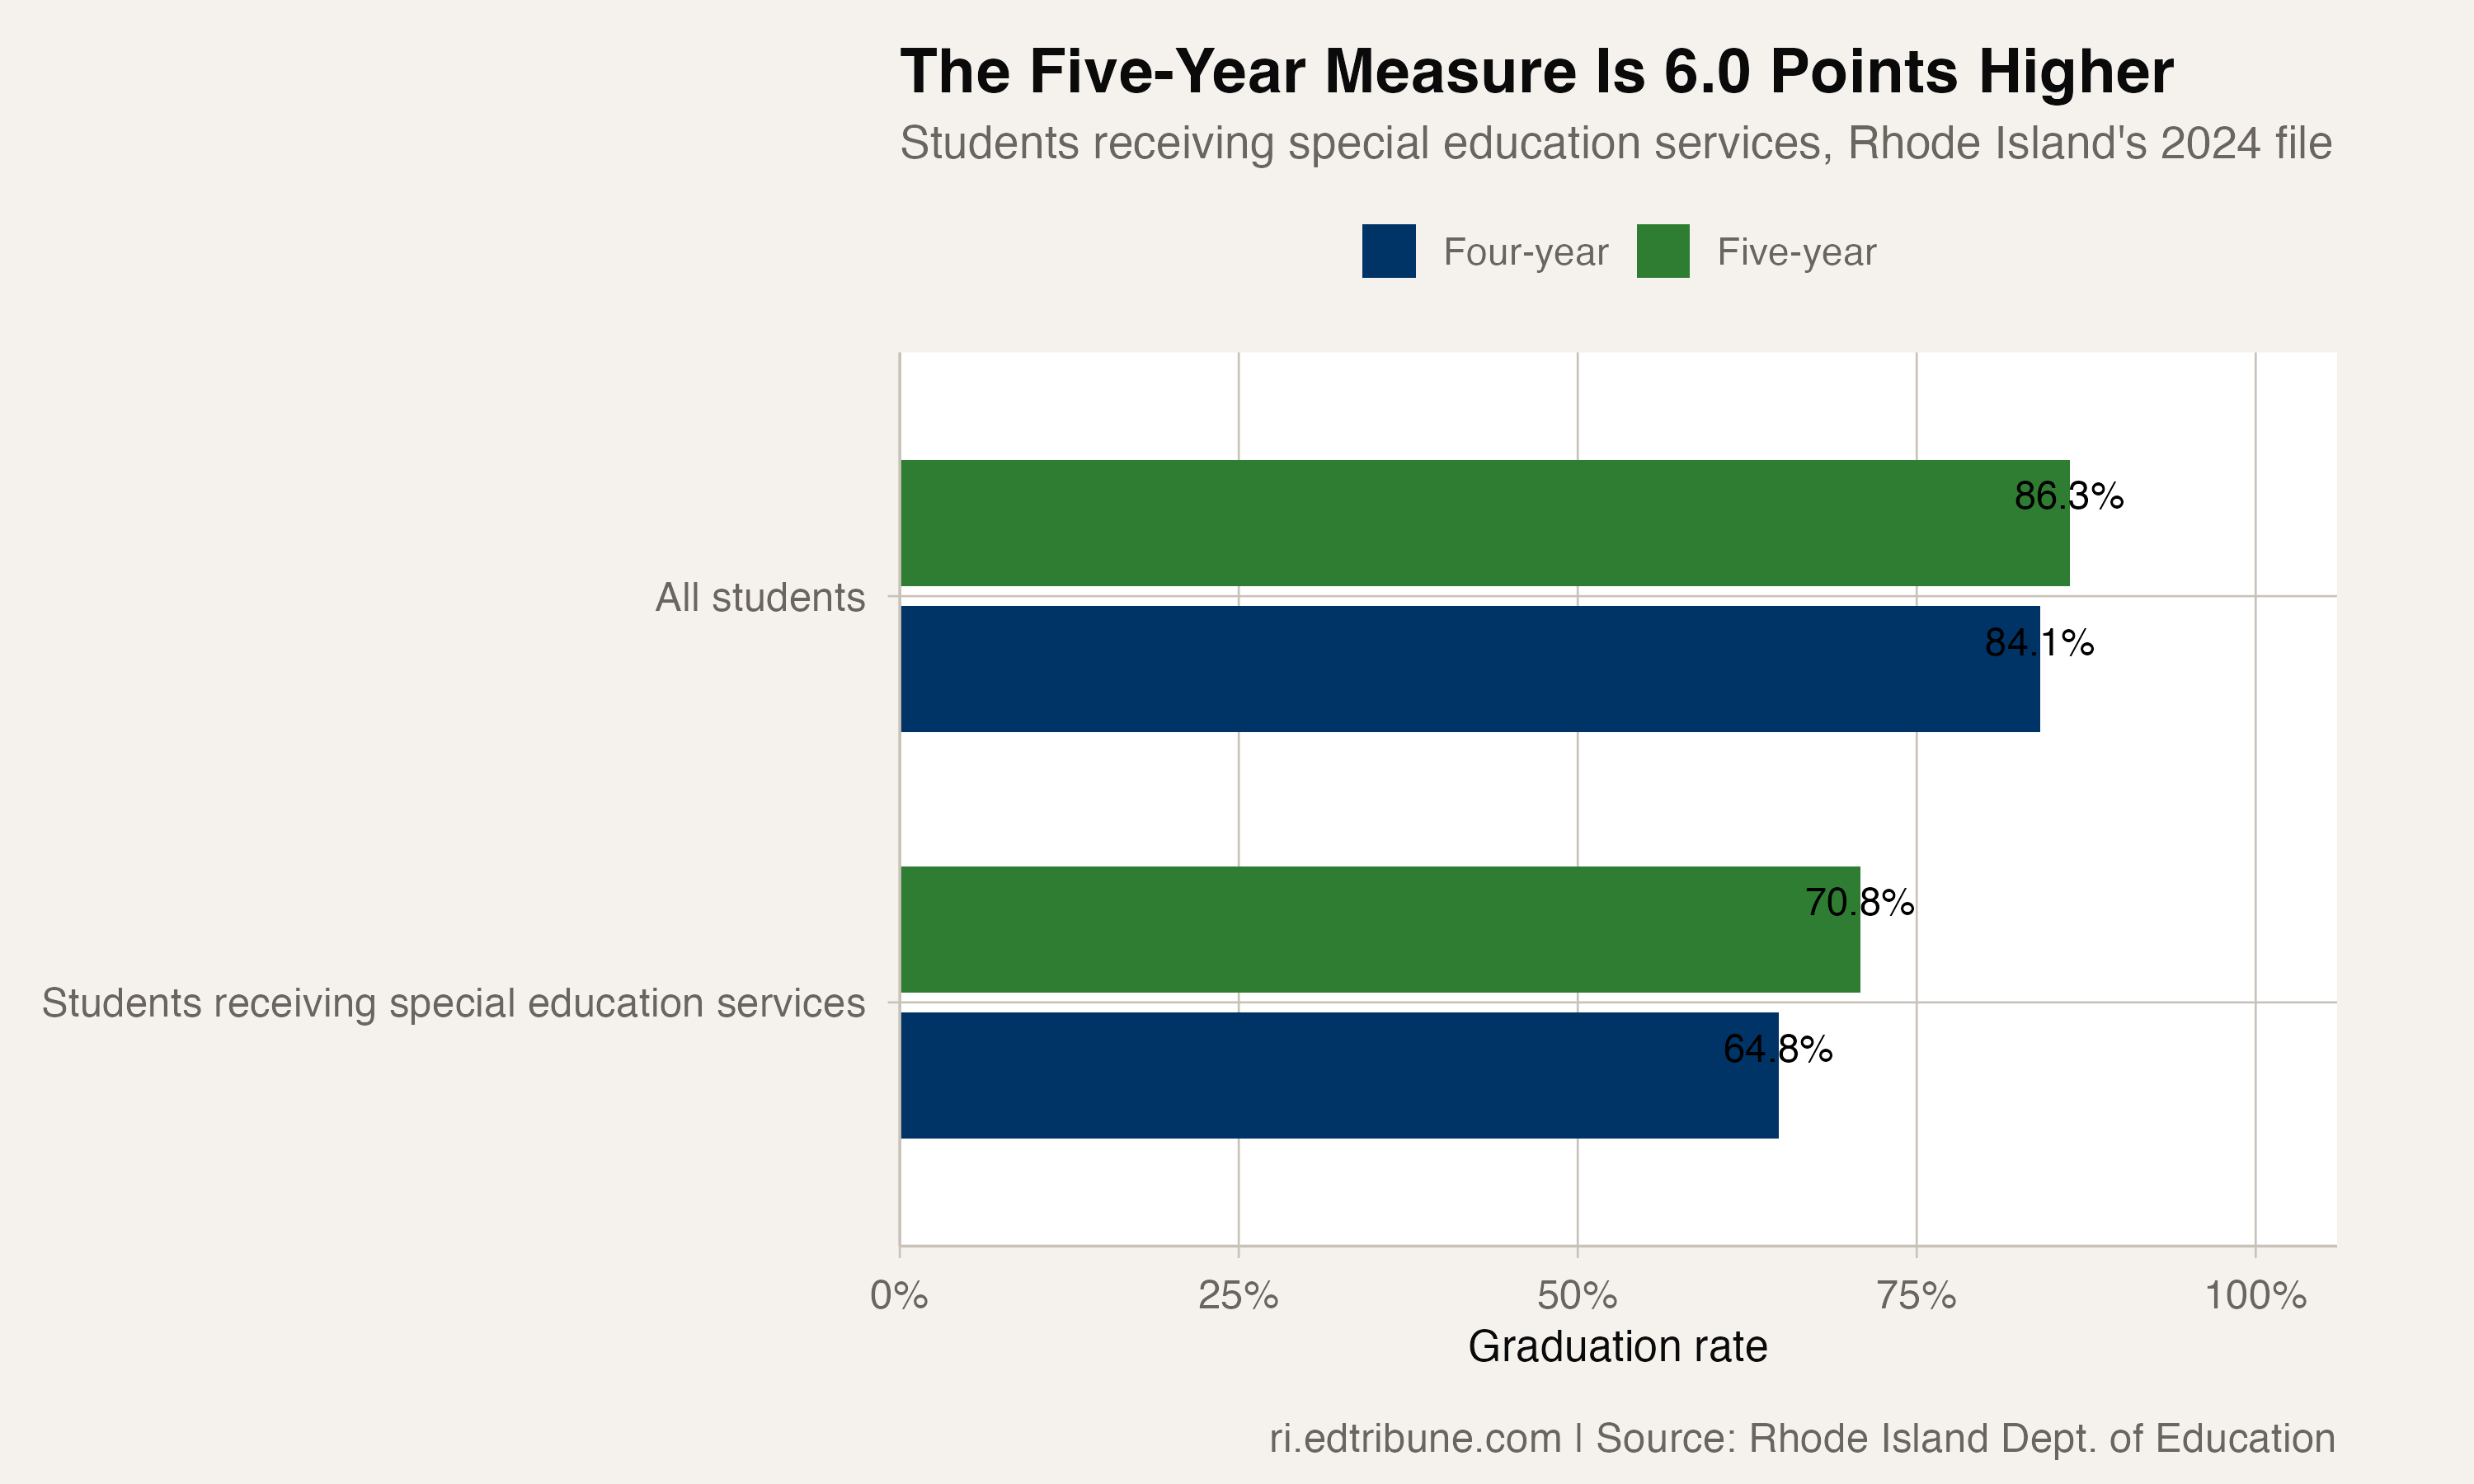
Direct evidence: the state file shows that the five-year measure adds more to the reported rate for students receiving special education services than it does statewide. It does not identify which services, circumstances or individual pathways account for that difference.
A gap across 15 reporting years
The four-year gap has moved, but it has not closed across Rhode Island's available 2010-2024 panel. It was 18.6 points in 2010 and 19.3 points in 2024, a difference of 0.7 point. Over the same span, the statewide rate rose from 75.8% to 84.1%, while the rate for students receiving special education services rose from 57.2% to 64.8%.
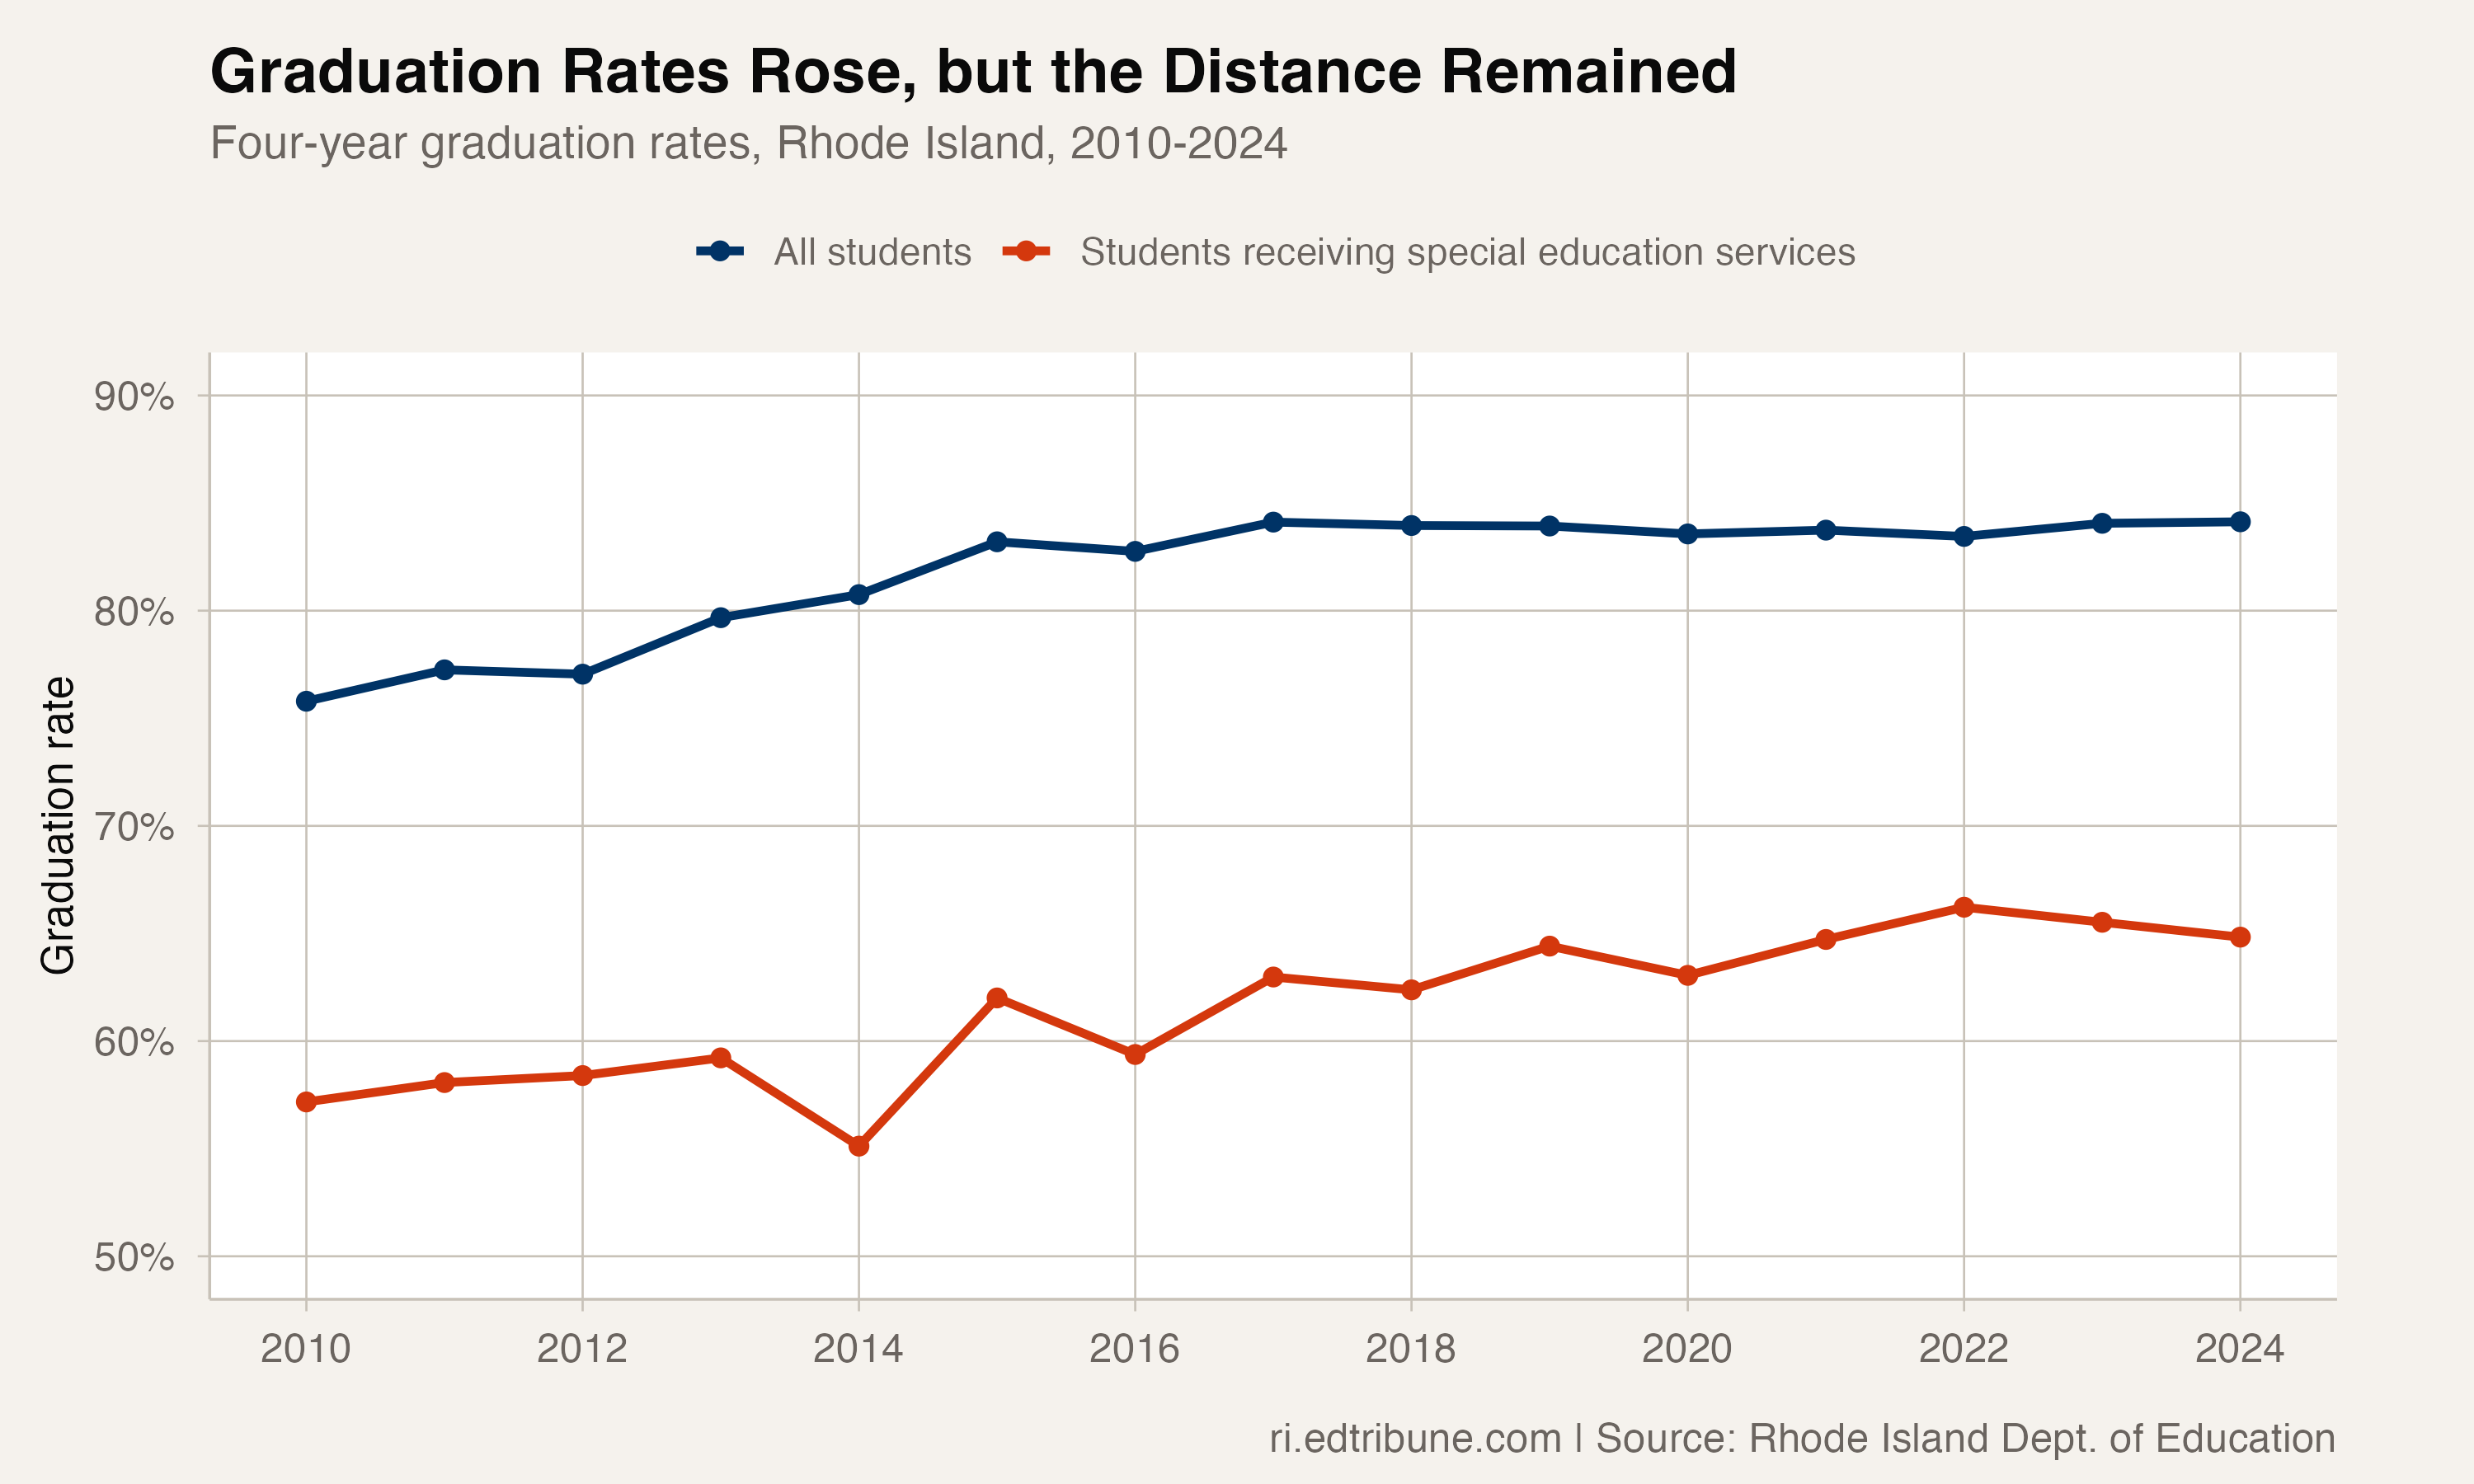
The 2024 four-year cohort included 1,740 students receiving special education services. The state file counted 1,128 graduates within four years, leaving 612 outside the four-year graduate count. Those students are not one outcome category: the aggregate file also reports dropout and other cohort outcomes, and some students remain enrolled beyond the fourth year.
The panel's widest gap
The widest four-year gap in the available panel was 25.6 points in 2014. The statewide rate was 80.7% that year, while the rate for students receiving special education services was 55.1%, the subgroup's lowest point in the panel. The gap then narrowed, though it did not disappear.
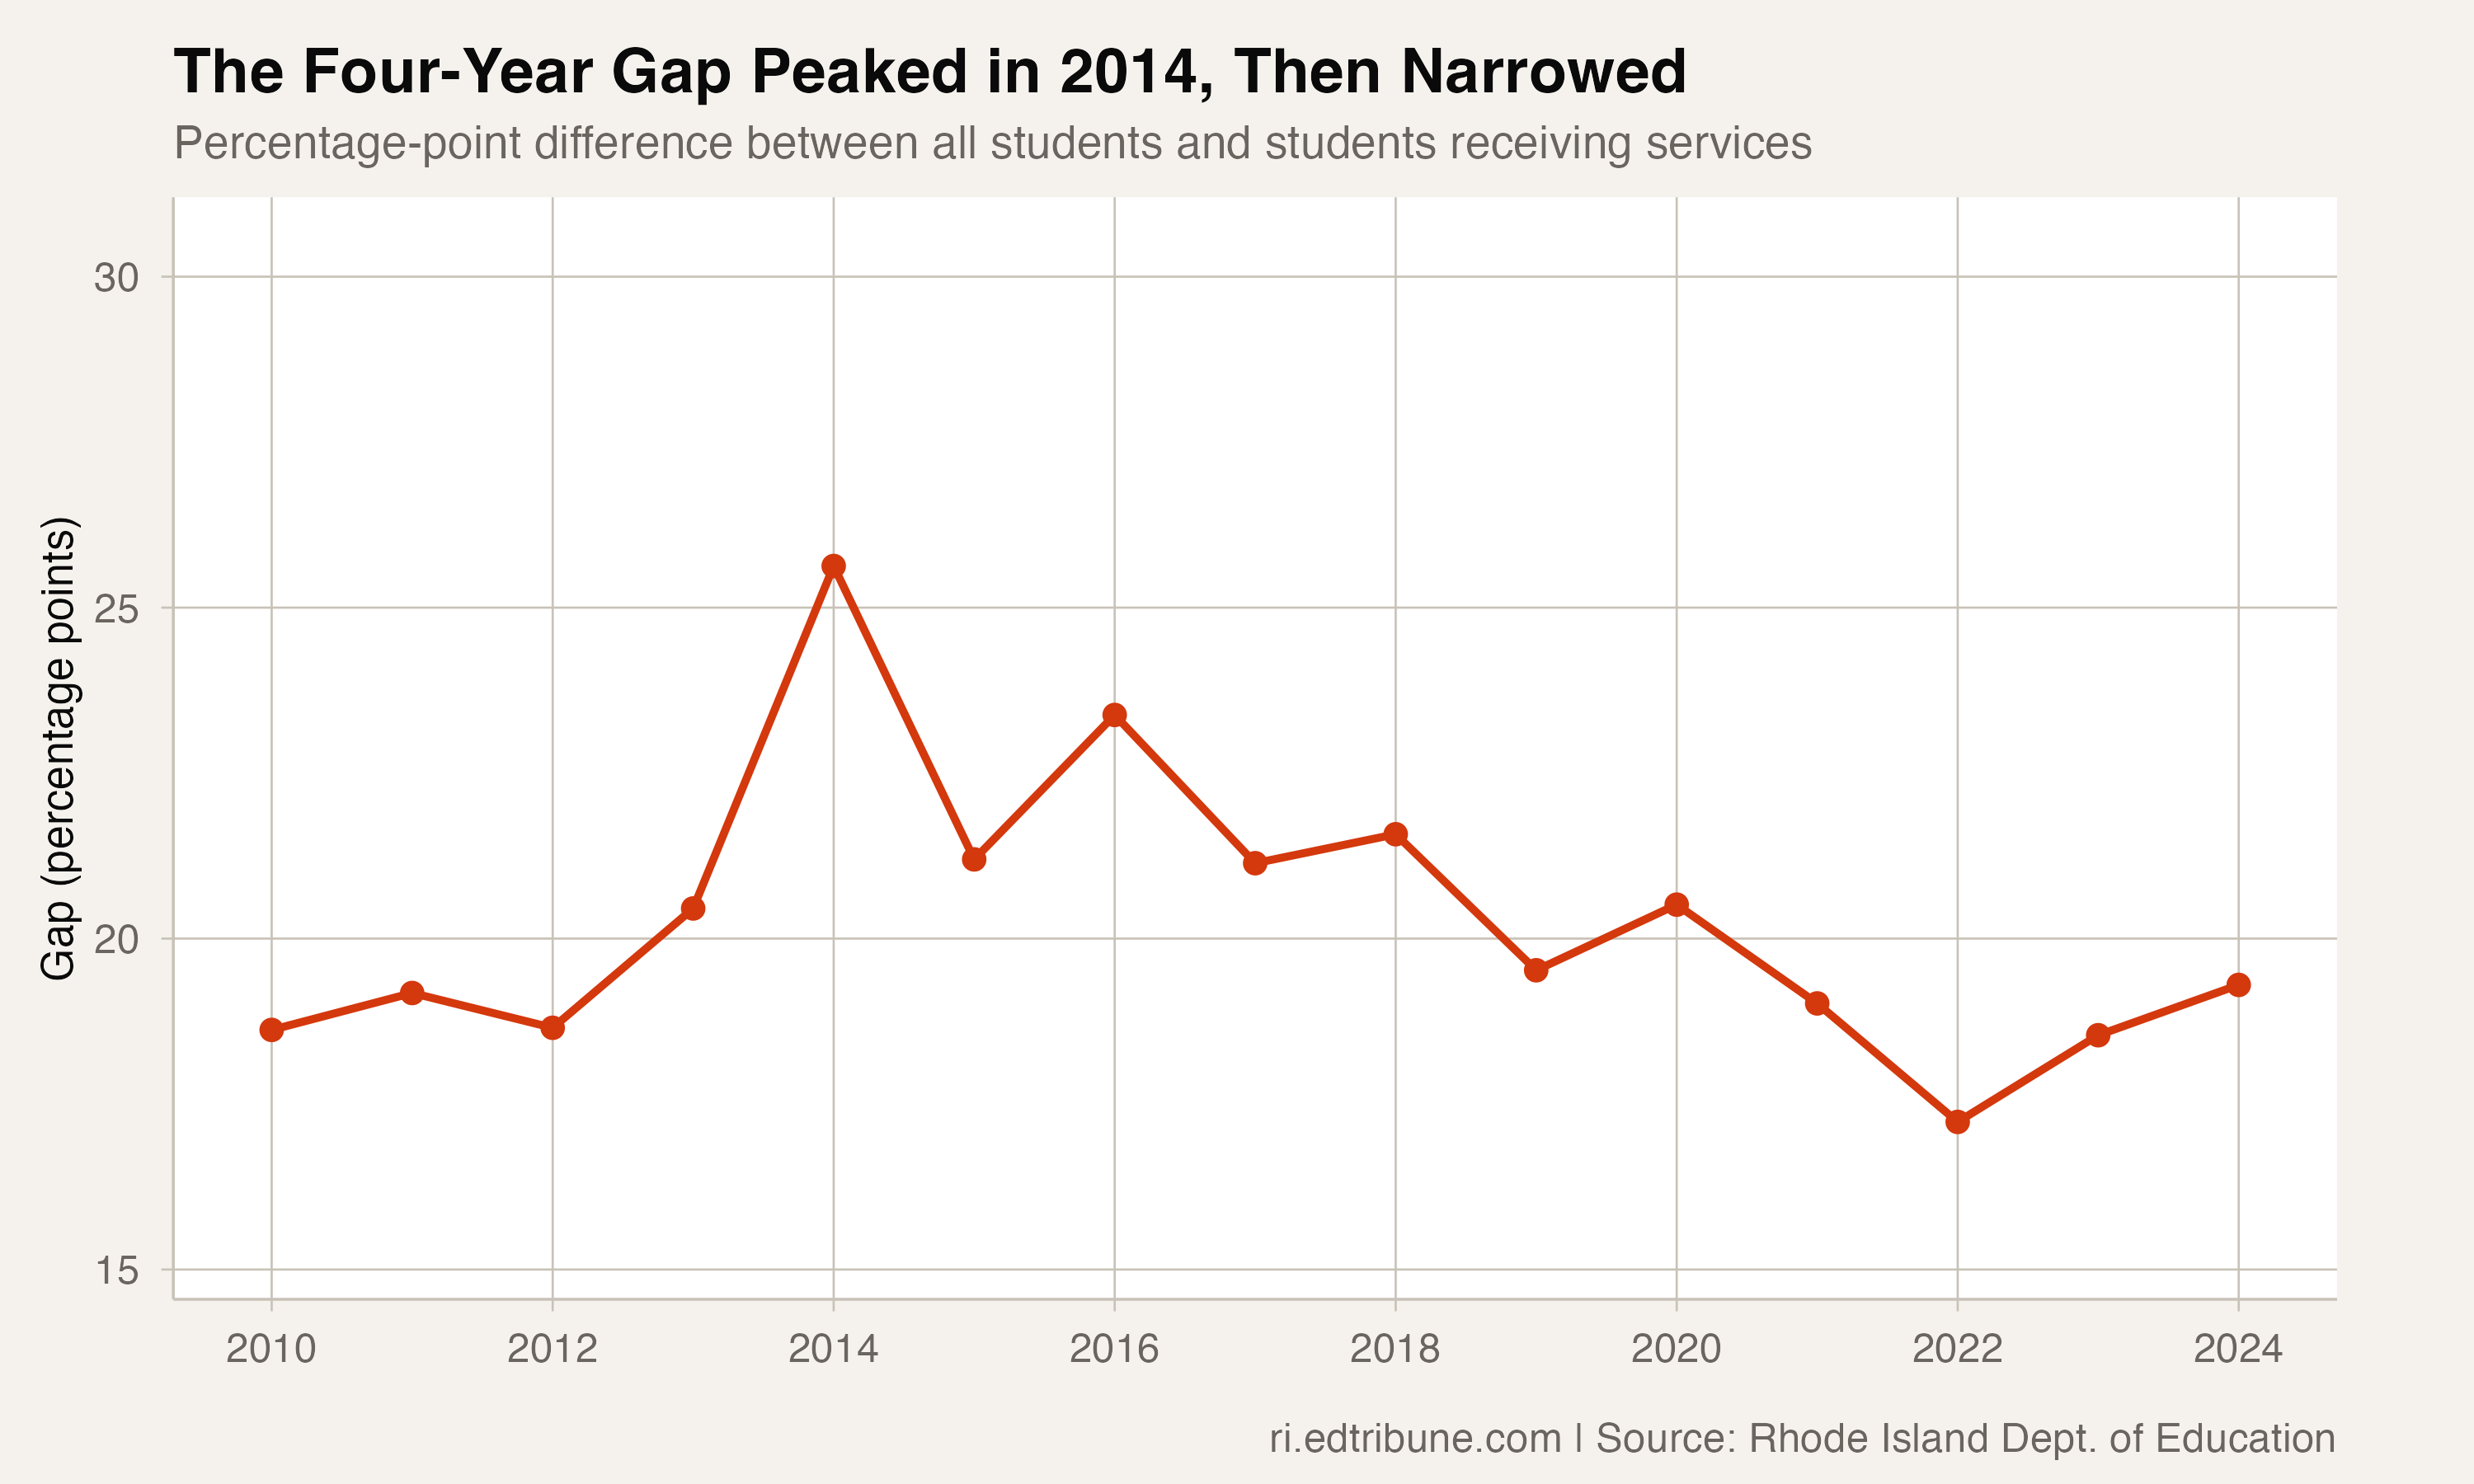
Unresourced: the graduation file does not establish why the gap widened or narrowed. It cannot separate attendance, credit accumulation, service access, disability mix, placement, family circumstances or school practices.
Why the longer measure matters
Suggestive context: RIDE describes secondary transition services as coordinated activities that support movement from school into postsecondary education, vocational education, employment, adult services, independent living and community participation. That framework makes a longer completion window relevant to students whose individualized programs extend beyond a conventional four-year timeline.
Competing explanation: the larger five-year difference can also include students who needed more time for credit recovery or other reasons that the aggregate graduation file does not identify. The data support the difference between the two reported measures, not a single explanation for it.
More students are receiving services
Rhode Island's published special education enrollment rose from 21,308 students in 2014-15 to 25,755 in 2025-26. Because those counts divide by RIDE's published statewide totals, the corresponding share of enrollment rose from 15.0% to 19.2%.
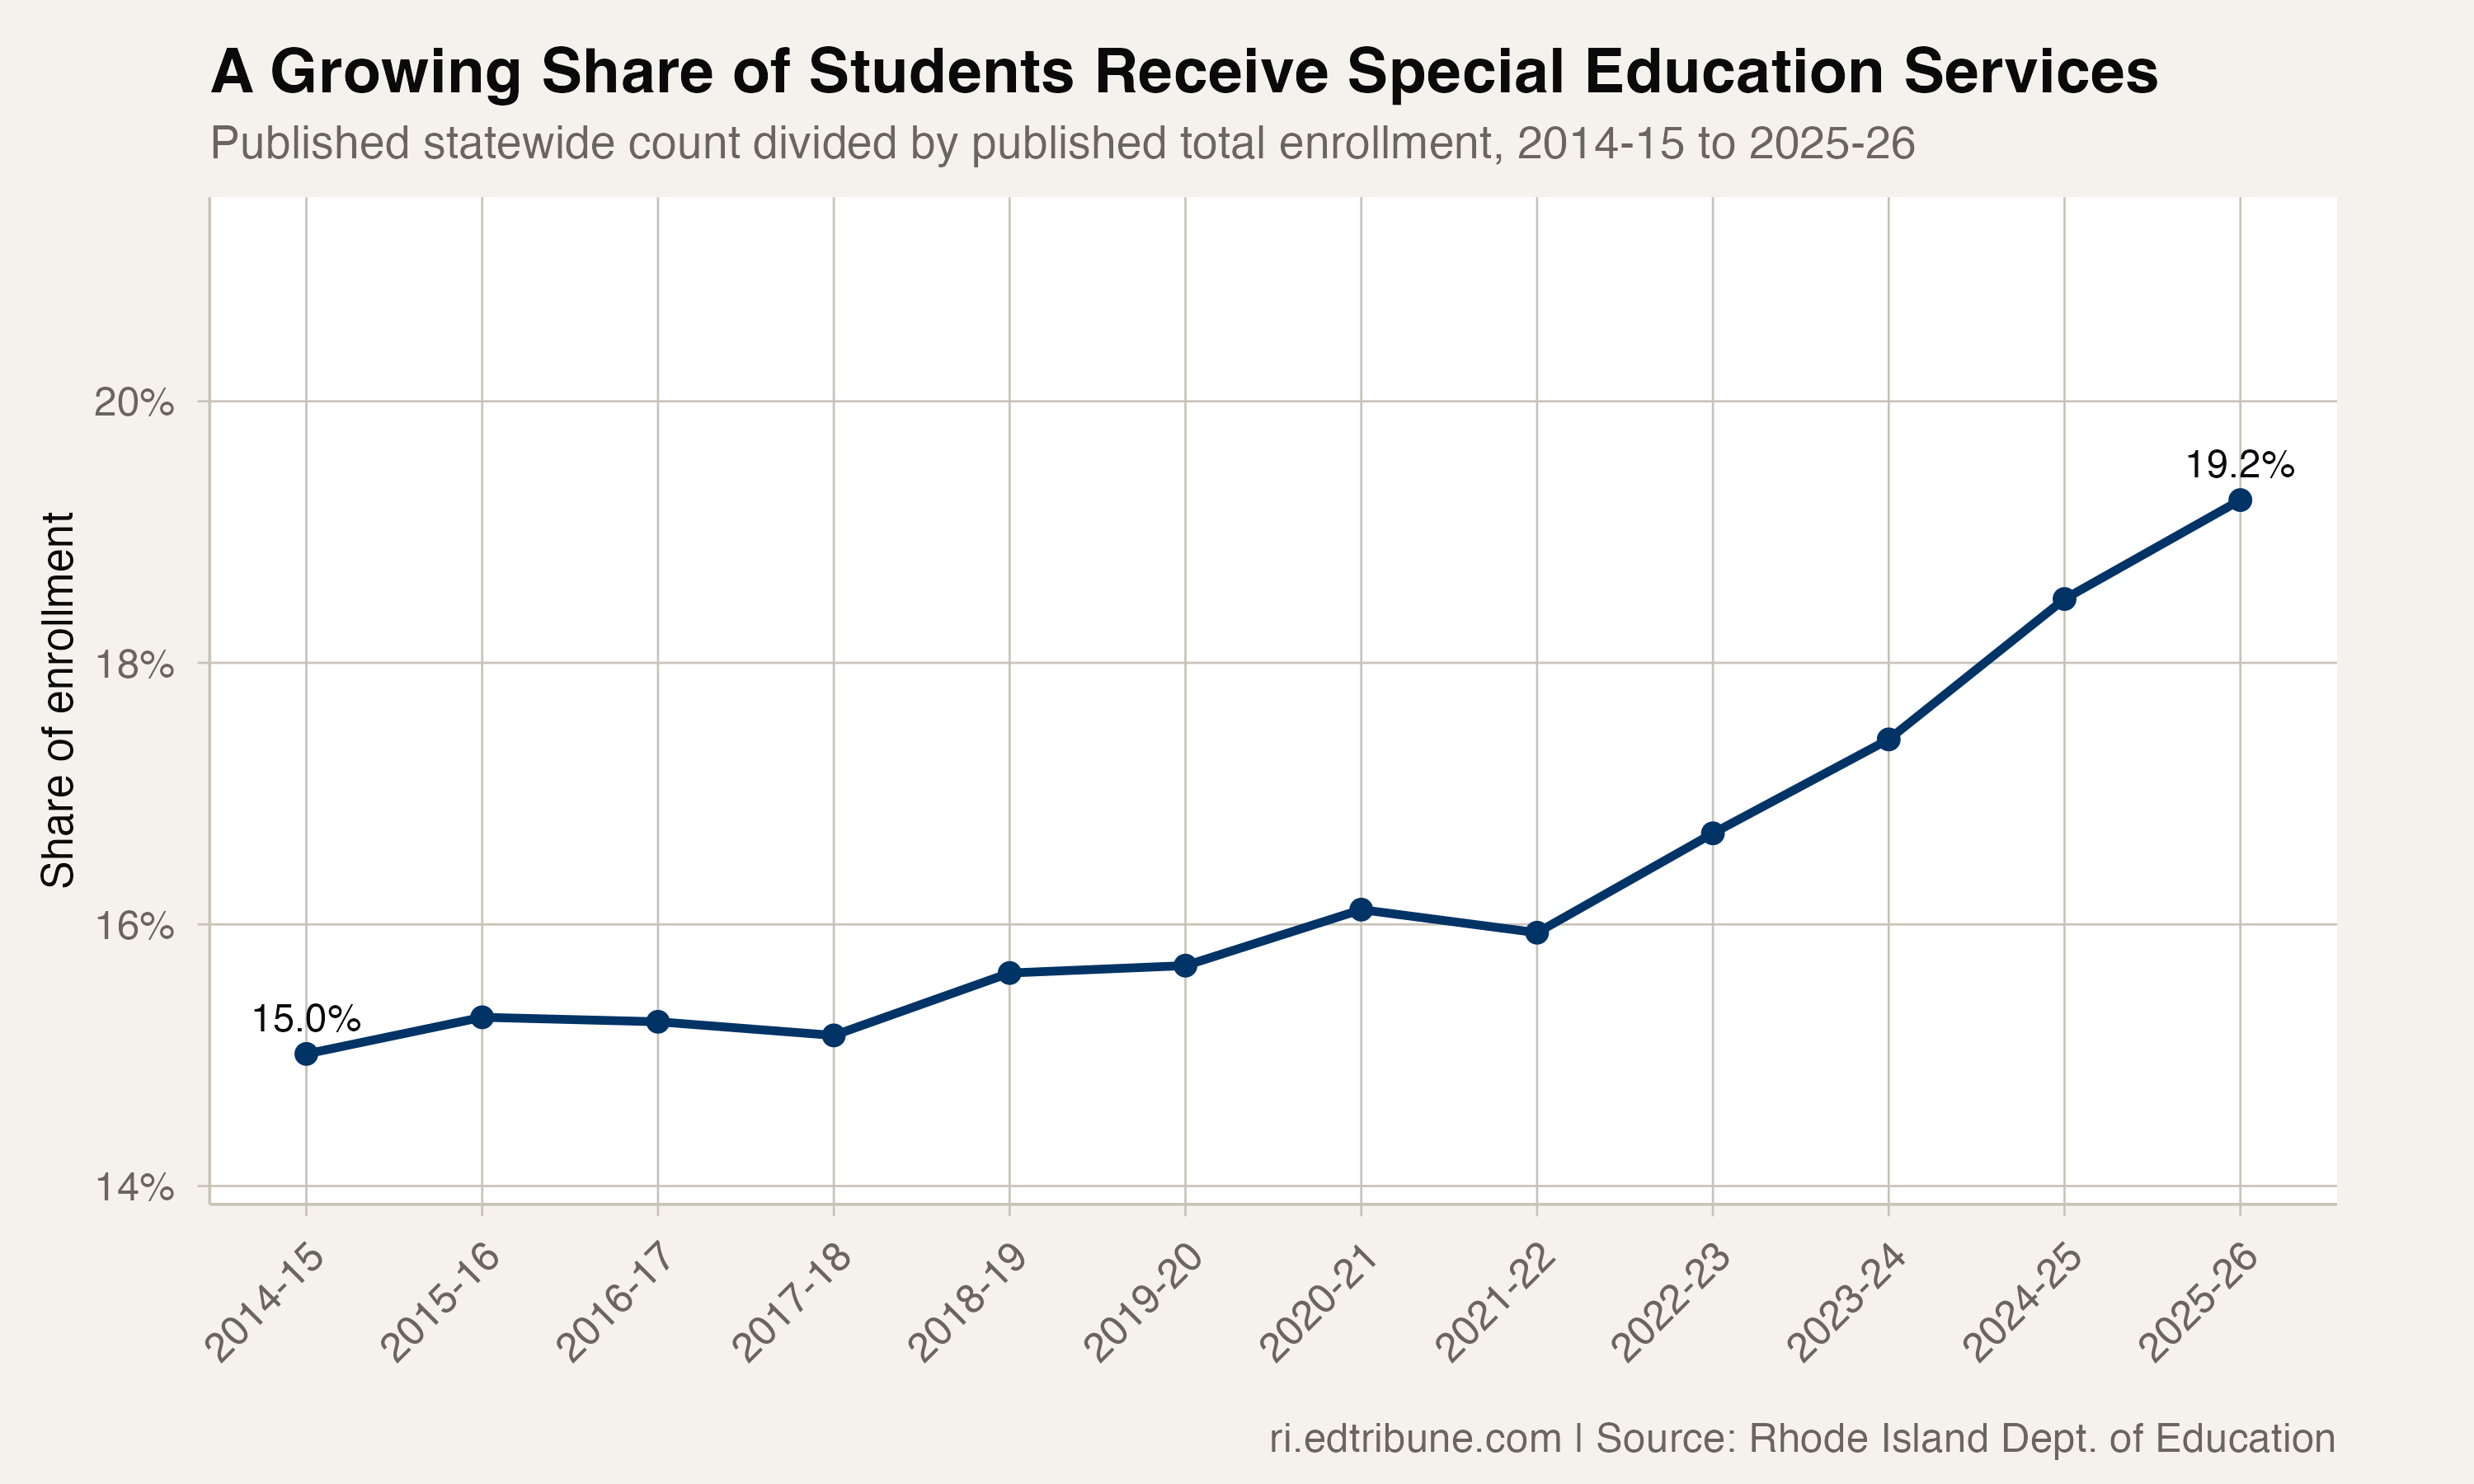
Direct evidence: the graduation and enrollment files show both a persistent completion gap and a growing share of students receiving services. They do not show which staffing, program or policy choices would narrow that gap. The practical question for districts is which supports help more students complete a diploma pathway within four years, and which students need a longer timeline.
Graduation and enrollment figures come from the Rhode Island Department of Education's Enrollment, Dropout, and Graduation Data.
Detailed code that reproduces the analysis and figures in this article is available exclusively to EdTribune subscribers.
Discussion
Sign in to join the discussion.
Loading comments...