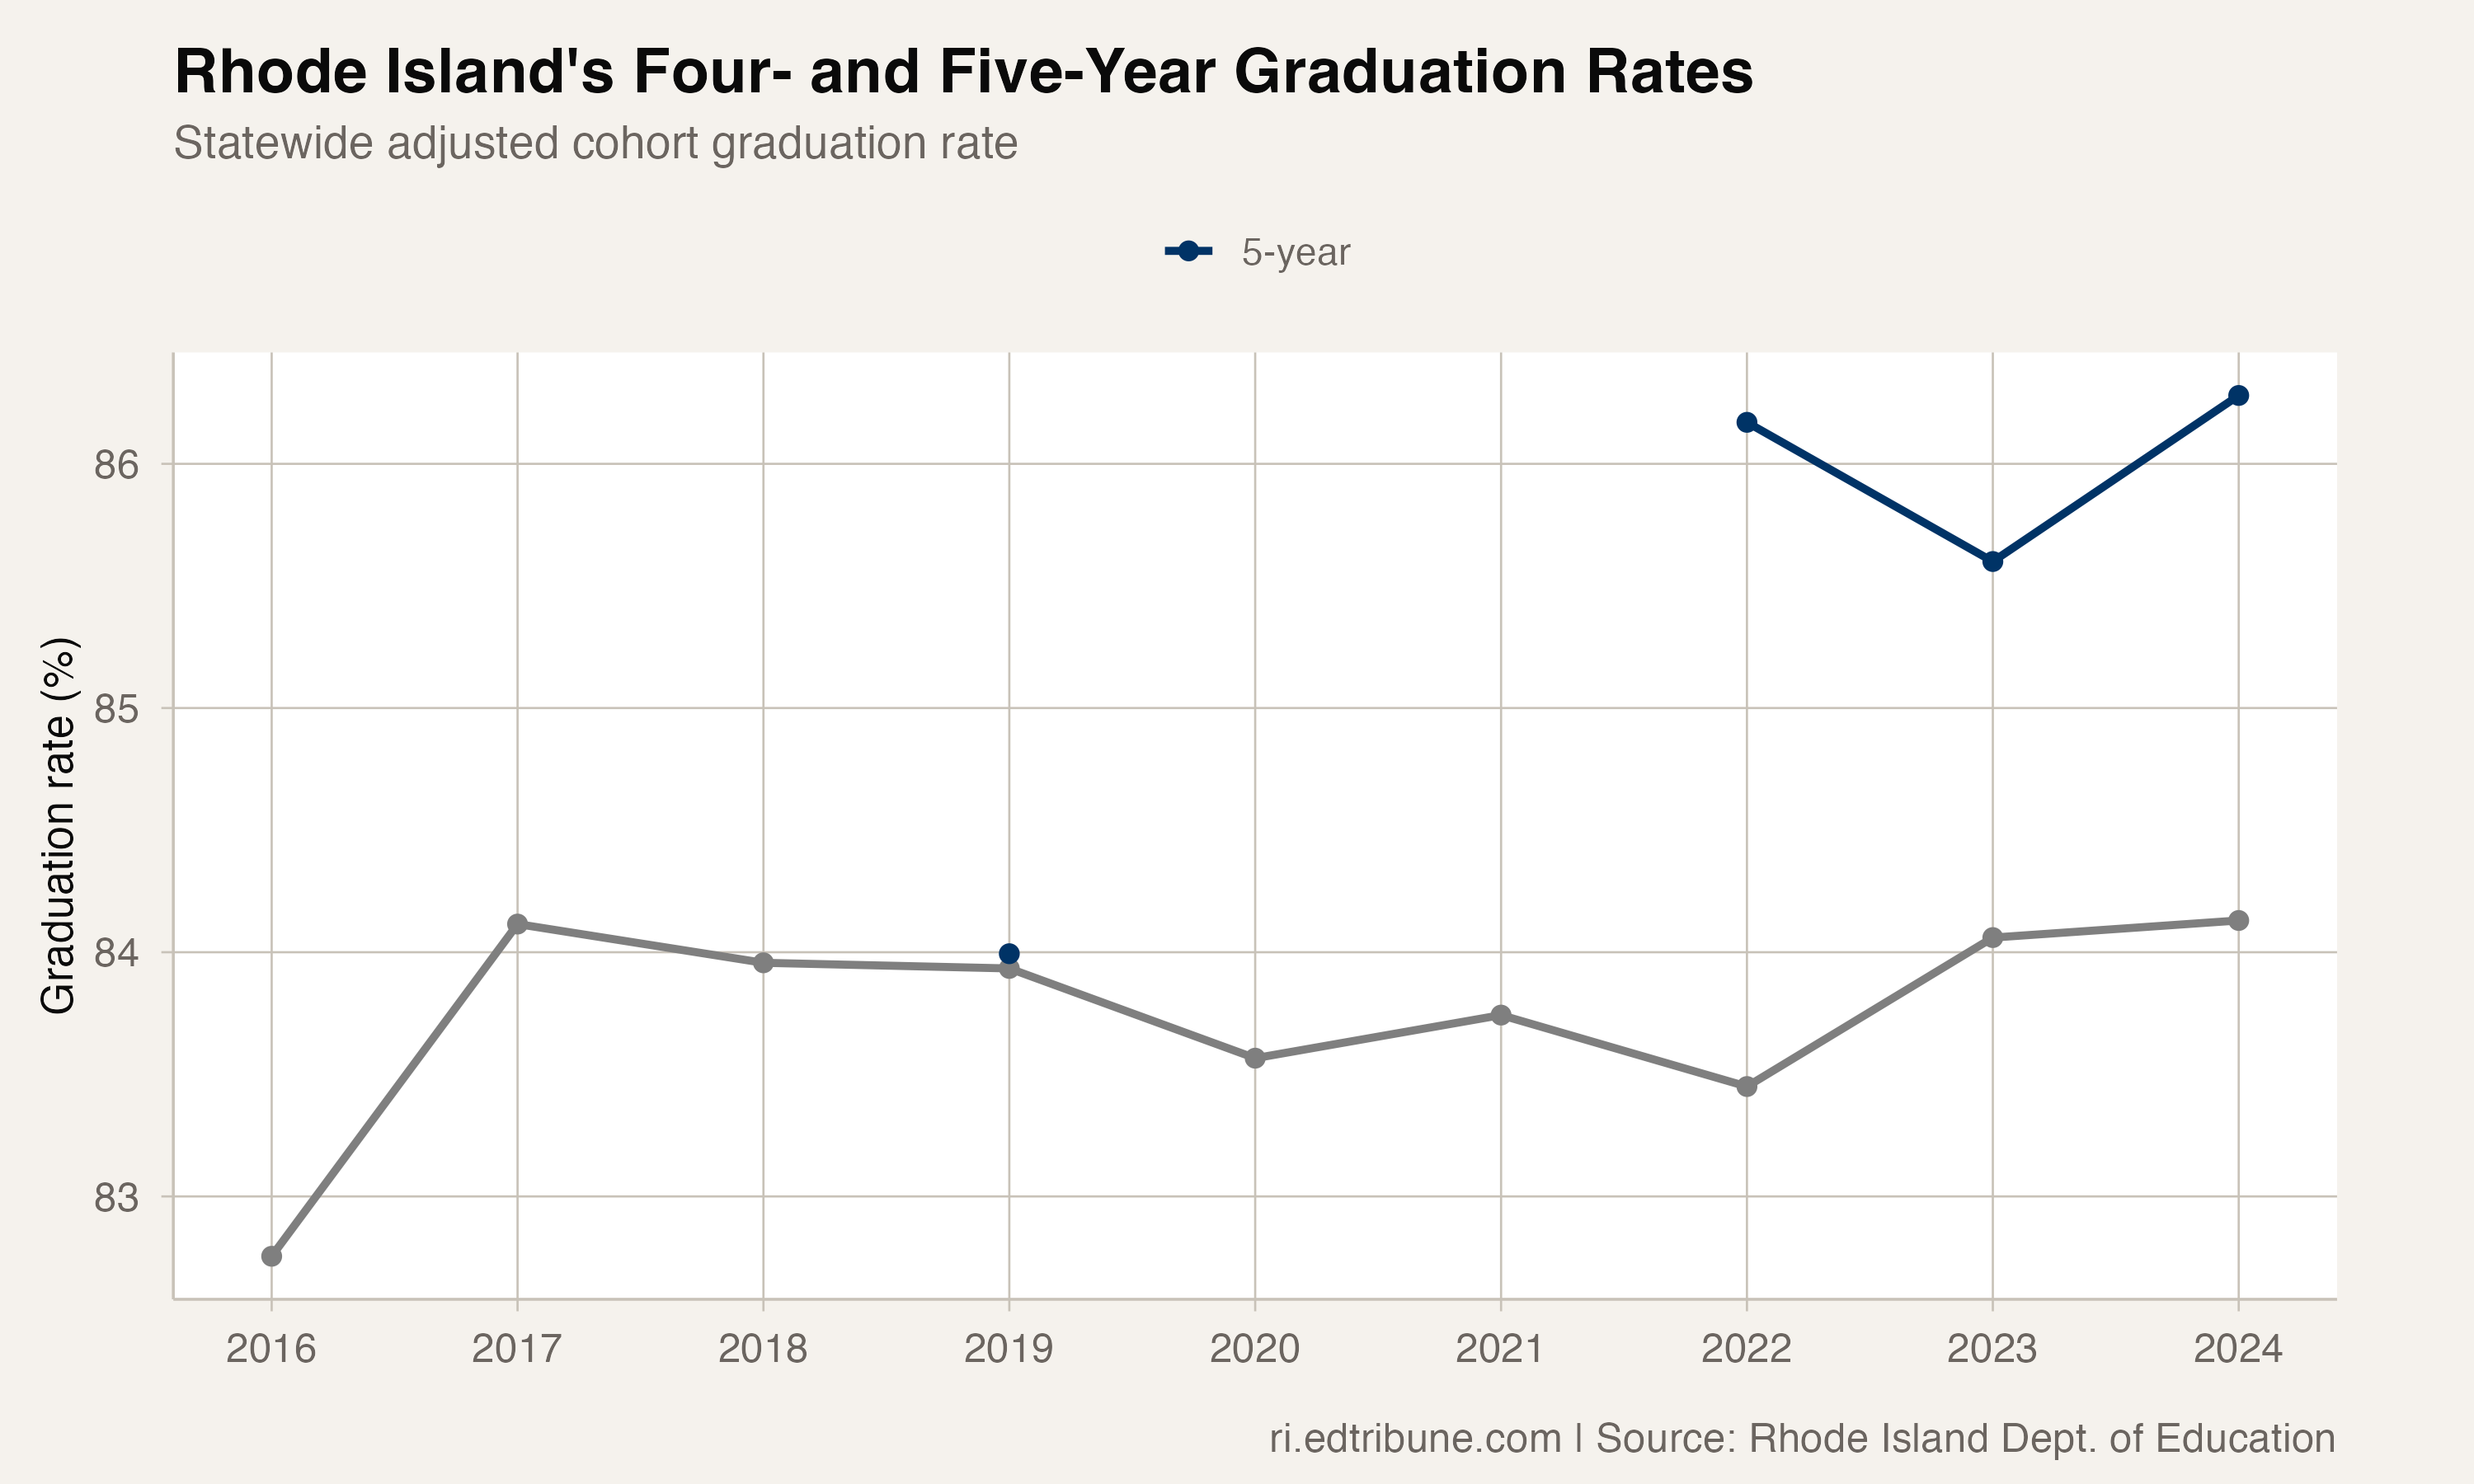
Rhode Island's five-year graduation rate of 86.3 percent in 2024 sits 2.2 percentage points above the four-year rate of 84.1 percent. For the average student, the extra year is a modest boost. For the state's most vulnerable students, it is a lifeline.
Foster care youth gain 8.6 percentage points — from 42.7 to 51.3 percent. Students who are currently homeless gain 7.6 points, from 59.0 to 66.7 percent. Special education students gain 6.0 points, from 64.8 to 70.8 percent. Black students gain 5.9 points, from 79.5 to 85.3 percent.
One subgroup breaks the pattern entirely: LEP students lose 0.3 percentage points with the extra year, from 73.9 to 73.6 percent. The fifth year does not help multilingual learners — it may actually select for students who are less likely to graduate.
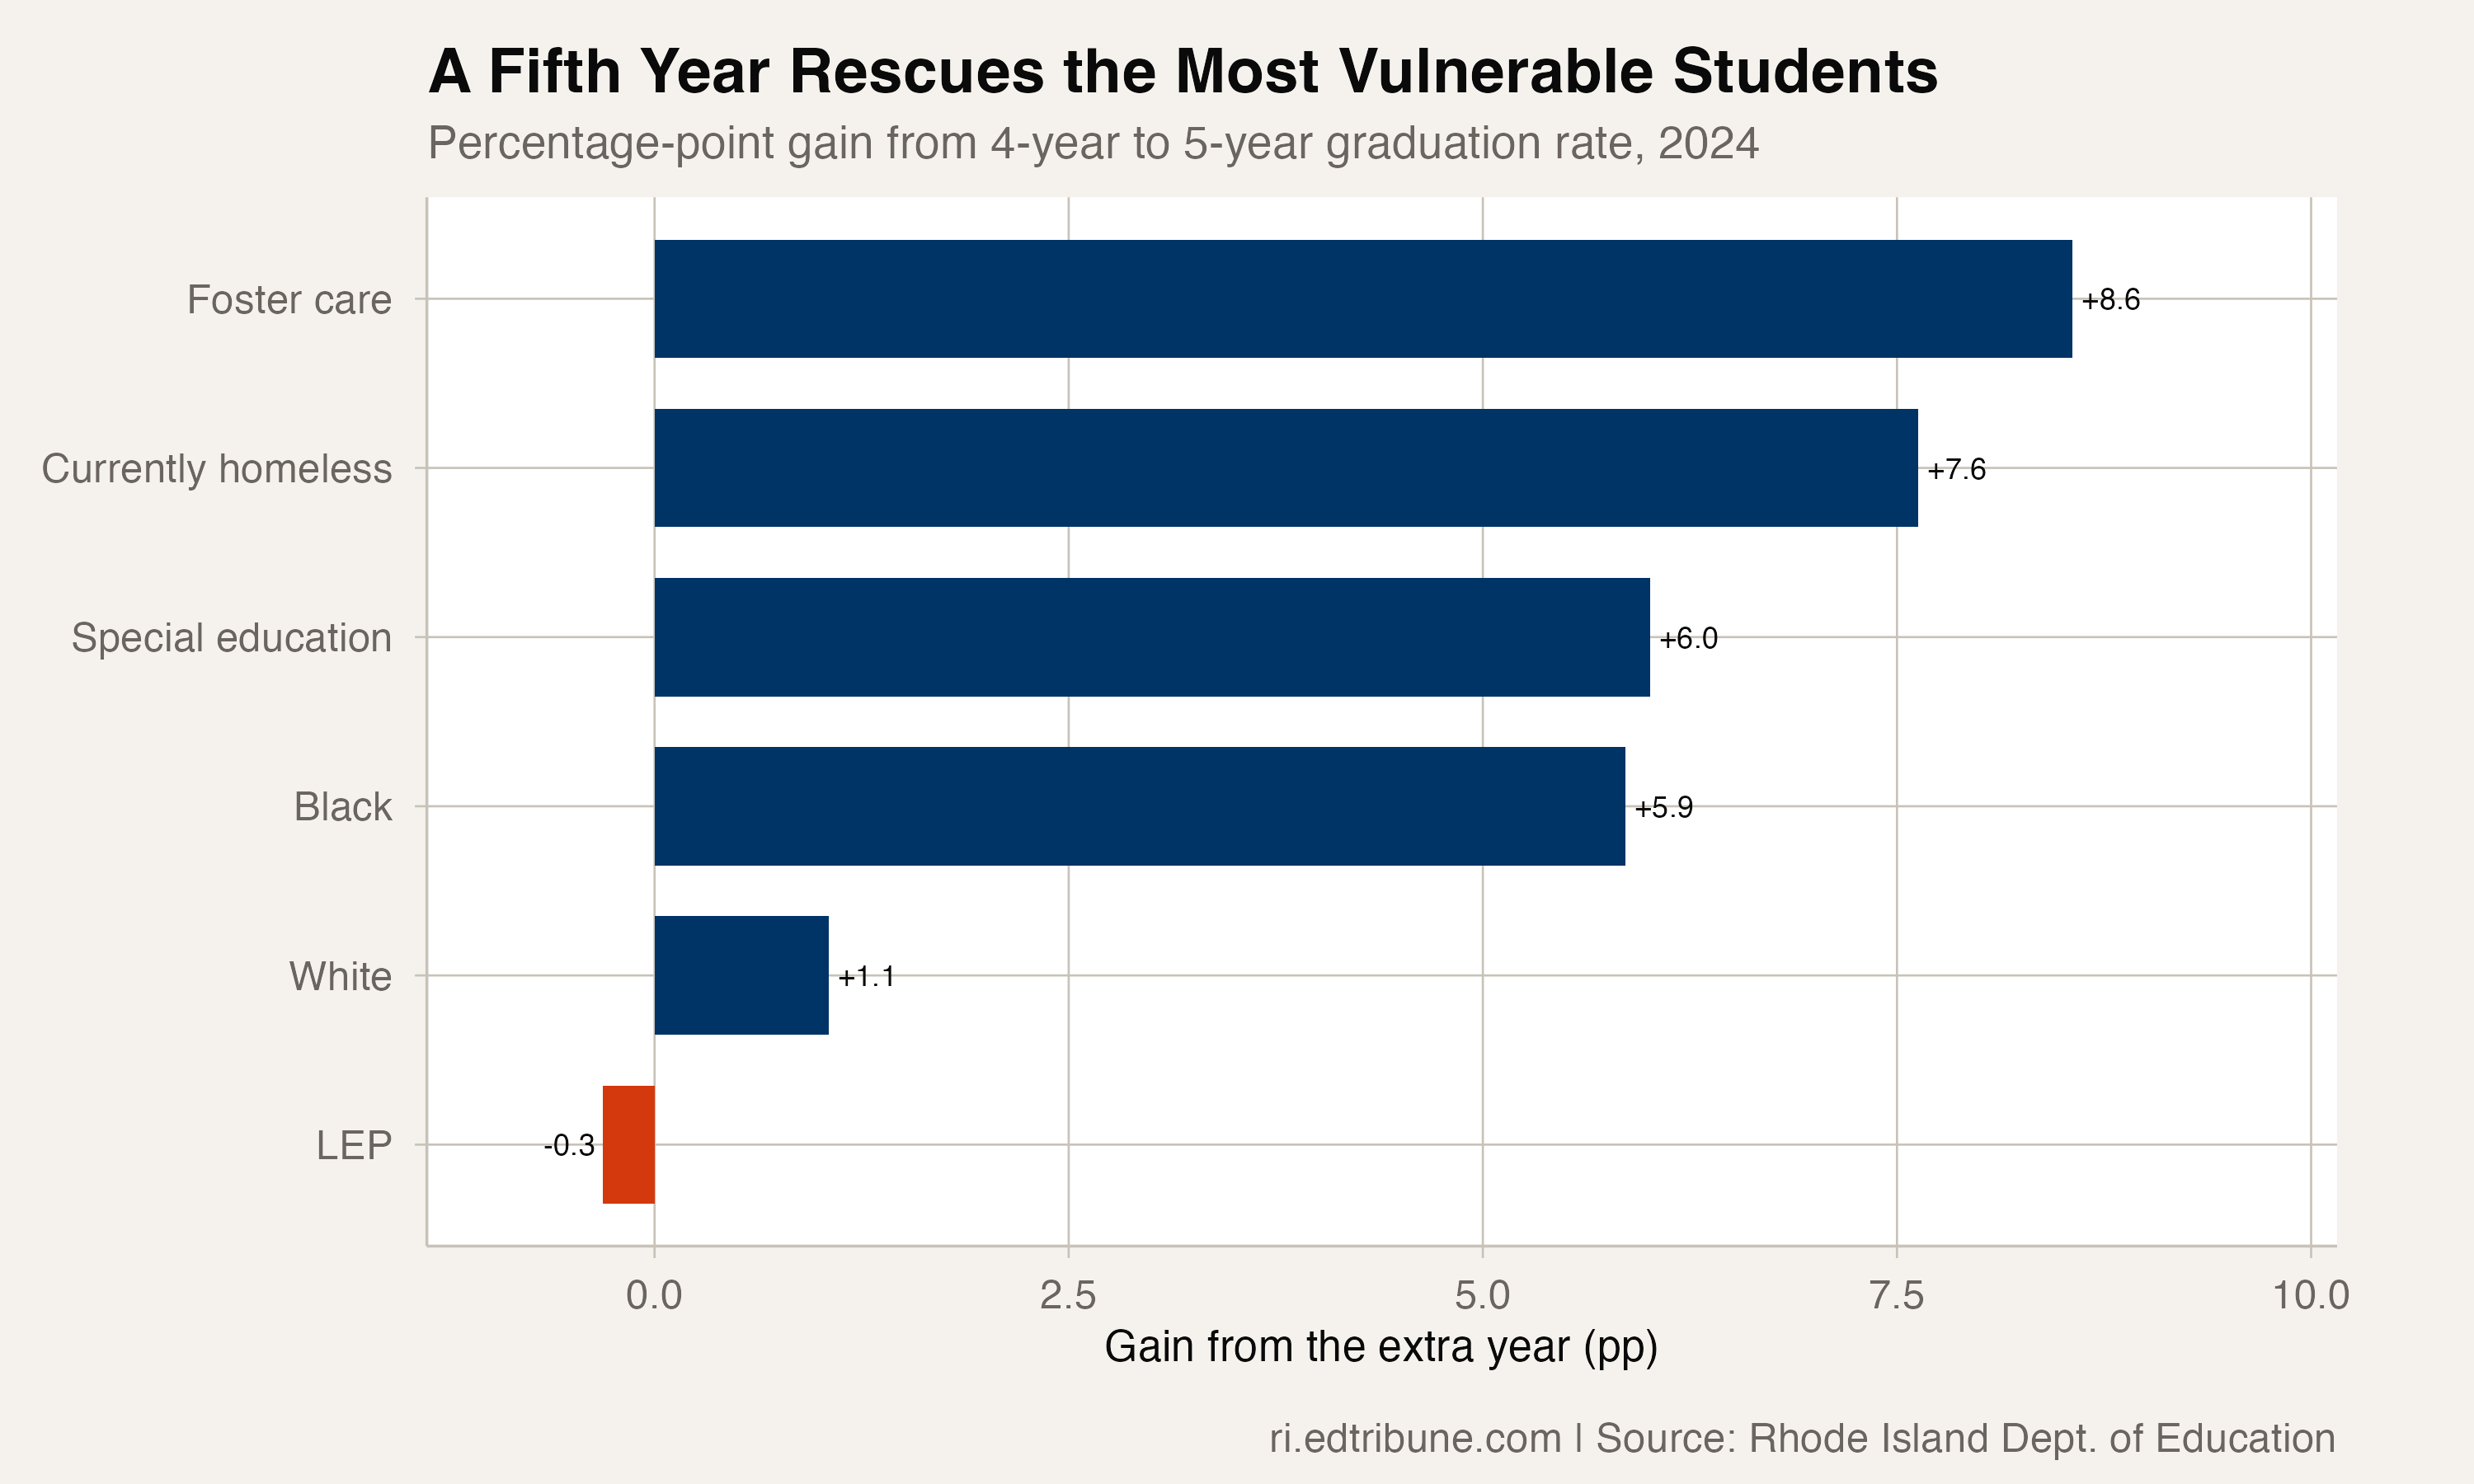
Who needs more time
The subgroups that benefit most from the fifth year share a common feature: their lives are defined by disruption. Foster care youth experience placement changes that trigger school changes. Students who are currently homeless move between shelters, doubled-up arrangements, and temporary housing. Special education students may need additional time to complete modified curricula or transition programming.
For these students, the four-year timeline is structurally mismatched with their circumstances. A student who changes schools twice in sophomore year may lose enough credits to make four-year graduation impossible through no fault of their own. The fifth year provides a recovery window — not because these students are slower learners, but because their circumstances cost them time.
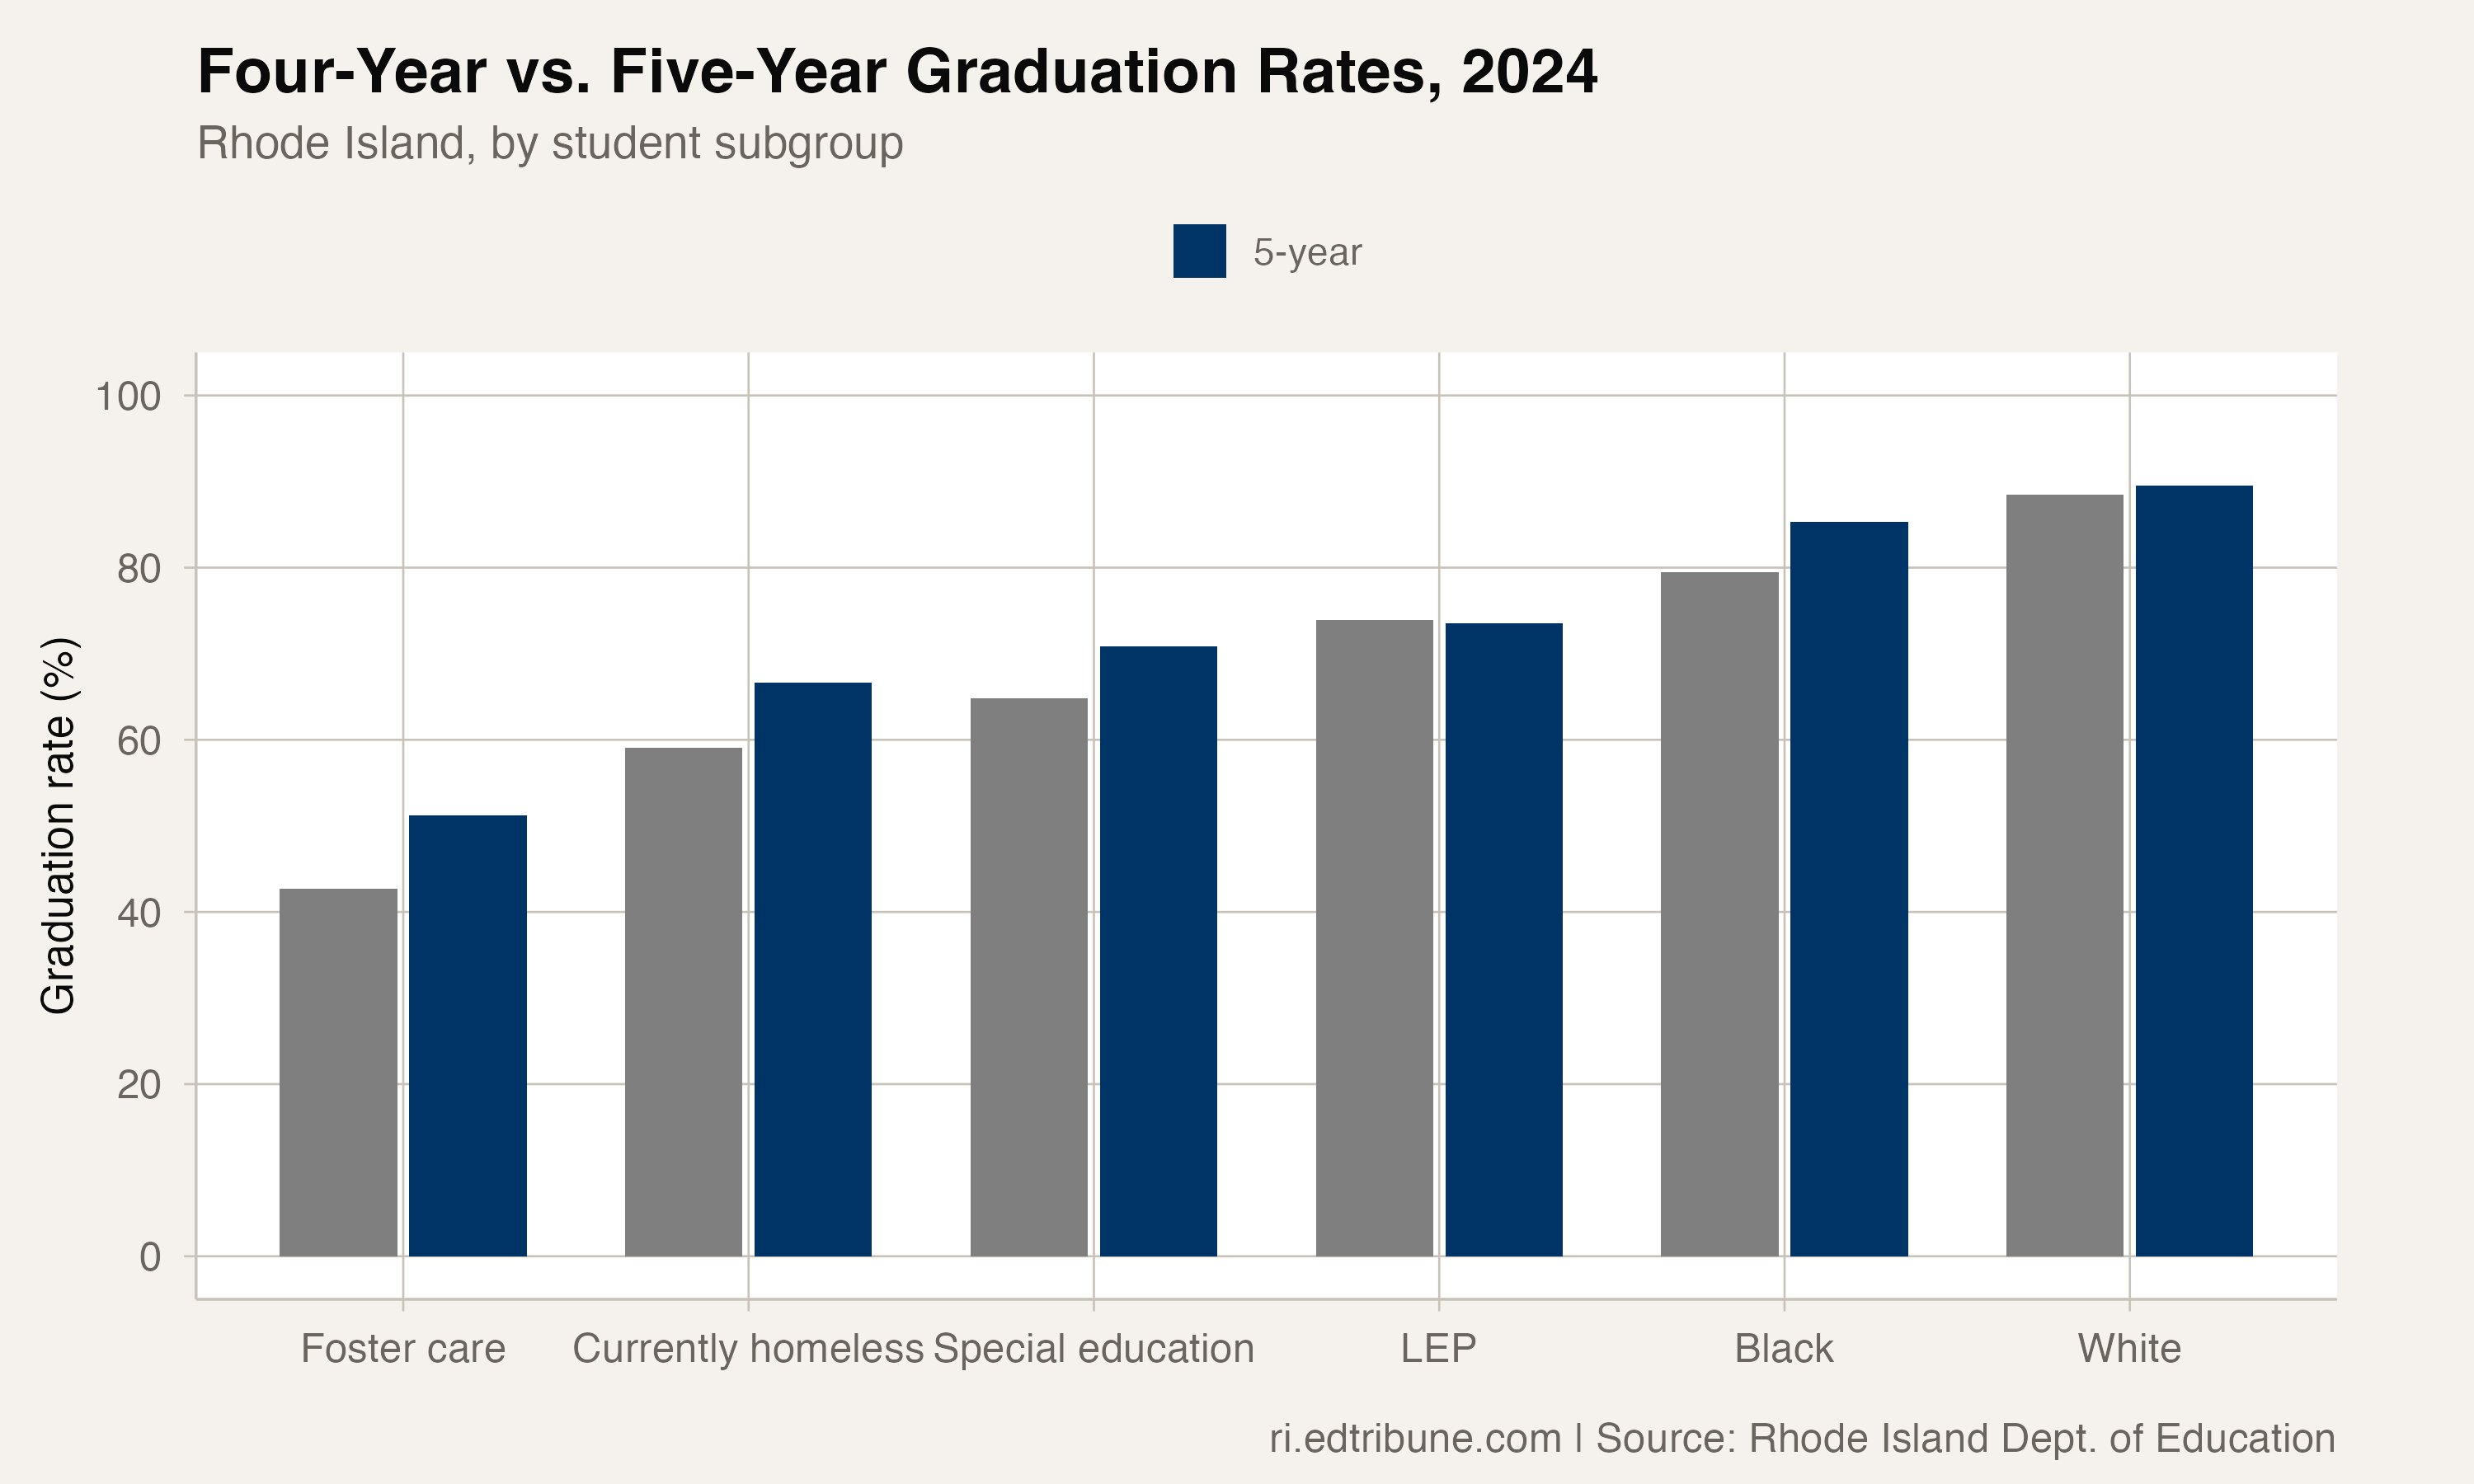
The size of the gain tends to track the four-year rate in reverse: the lower the starting point, the bigger the fifth-year boost. Foster care students, who post the lowest four-year rate of any subgroup at 42.7 percent, gain the most among the state's major subgroups, 8.6 points. White students, whose 88.5 percent four-year rate is among the highest, gain just 1.1 points, the smallest boost of any major subgroup that benefits from the fifth year. Students who are already likely to graduate in four years have less room for the fifth year to help.
The LEP exception
The finding that LEP students do not benefit from a fifth year, and actually perform slightly worse, at 73.6 percent versus 73.9 percent, deserves attention. Every other major subgroup gains from the extra time. Among the state's major student subgroups, LEP students are the sole exception.
Several explanations are possible. Students who remain classified as LEP in their fifth year of high school may face challenges that additional time cannot resolve — academic gaps accumulated over years of inadequate language support, for instance, or family obligations that pull them out of school. The fifth-year LEP cohort may also be a negatively selected group: the LEP students who were most likely to succeed graduated in four years, leaving a fifth-year pool that is harder to serve.
The data also shows that former LEP students — those reclassified as English proficient — graduate at just 69.2 percent. Reclassification out of LEP status does not predict graduation success, suggesting that the language proficiency threshold used for reclassification does not capture the academic readiness needed to finish high school.
The policy tension
Rhode Island, like most states, primarily measures and reports four-year graduation rates. Federal accountability under the Every Student Succeeds Act weights the four-year rate most heavily. This creates an incentive structure where schools are evaluated on a timeline that systematically disadvantages their most vulnerable students.
Advocates for students with disabilities, homeless youth, and foster care youth have argued that the four-year metric penalizes the students who need more time rather than less. A student who graduates in five years has the same diploma, the same access to college and careers, and the same life trajectory as one who graduates in four. The only difference is the reporting metric.
The counterargument is that extending the timeline lowers urgency. If schools know that students will be counted again at five years, there is less pressure to get them to graduation in four. The four-year rate serves as a pressure mechanism that benefits most students, even if it unfairly measures a few.
Rhode Island's data suggests the truth is more nuanced than either position. The 2.2-point statewide gap between four-year and five-year rates is not large enough to suggest widespread complacency. But the 8.6-point gap for foster care students and the 7.6-point gap for students who are currently homeless is large enough to suggest that the four-year metric is telling an incomplete story about whether the education system is serving its most vulnerable students.
What 86.3 percent still leaves behind
Even the five-year rate leaves meaningful numbers of students without diplomas. After five years, roughly 49 percent of foster care youth, 33 percent of students who are currently homeless, and 29 percent of special education students still have not graduated. The fifth year helps, but it does not solve the problem.
The students who fail to graduate even in five years are likely facing barriers that more time alone cannot address — severe mental health challenges, incarceration, complete disengagement from the education system, or life circumstances that make school attendance functionally impossible.
Detailed code that reproduces the analysis and figures in this article is available exclusively to EdTribune subscribers.
Discussion
Sign in to join the discussion.
Loading comments...