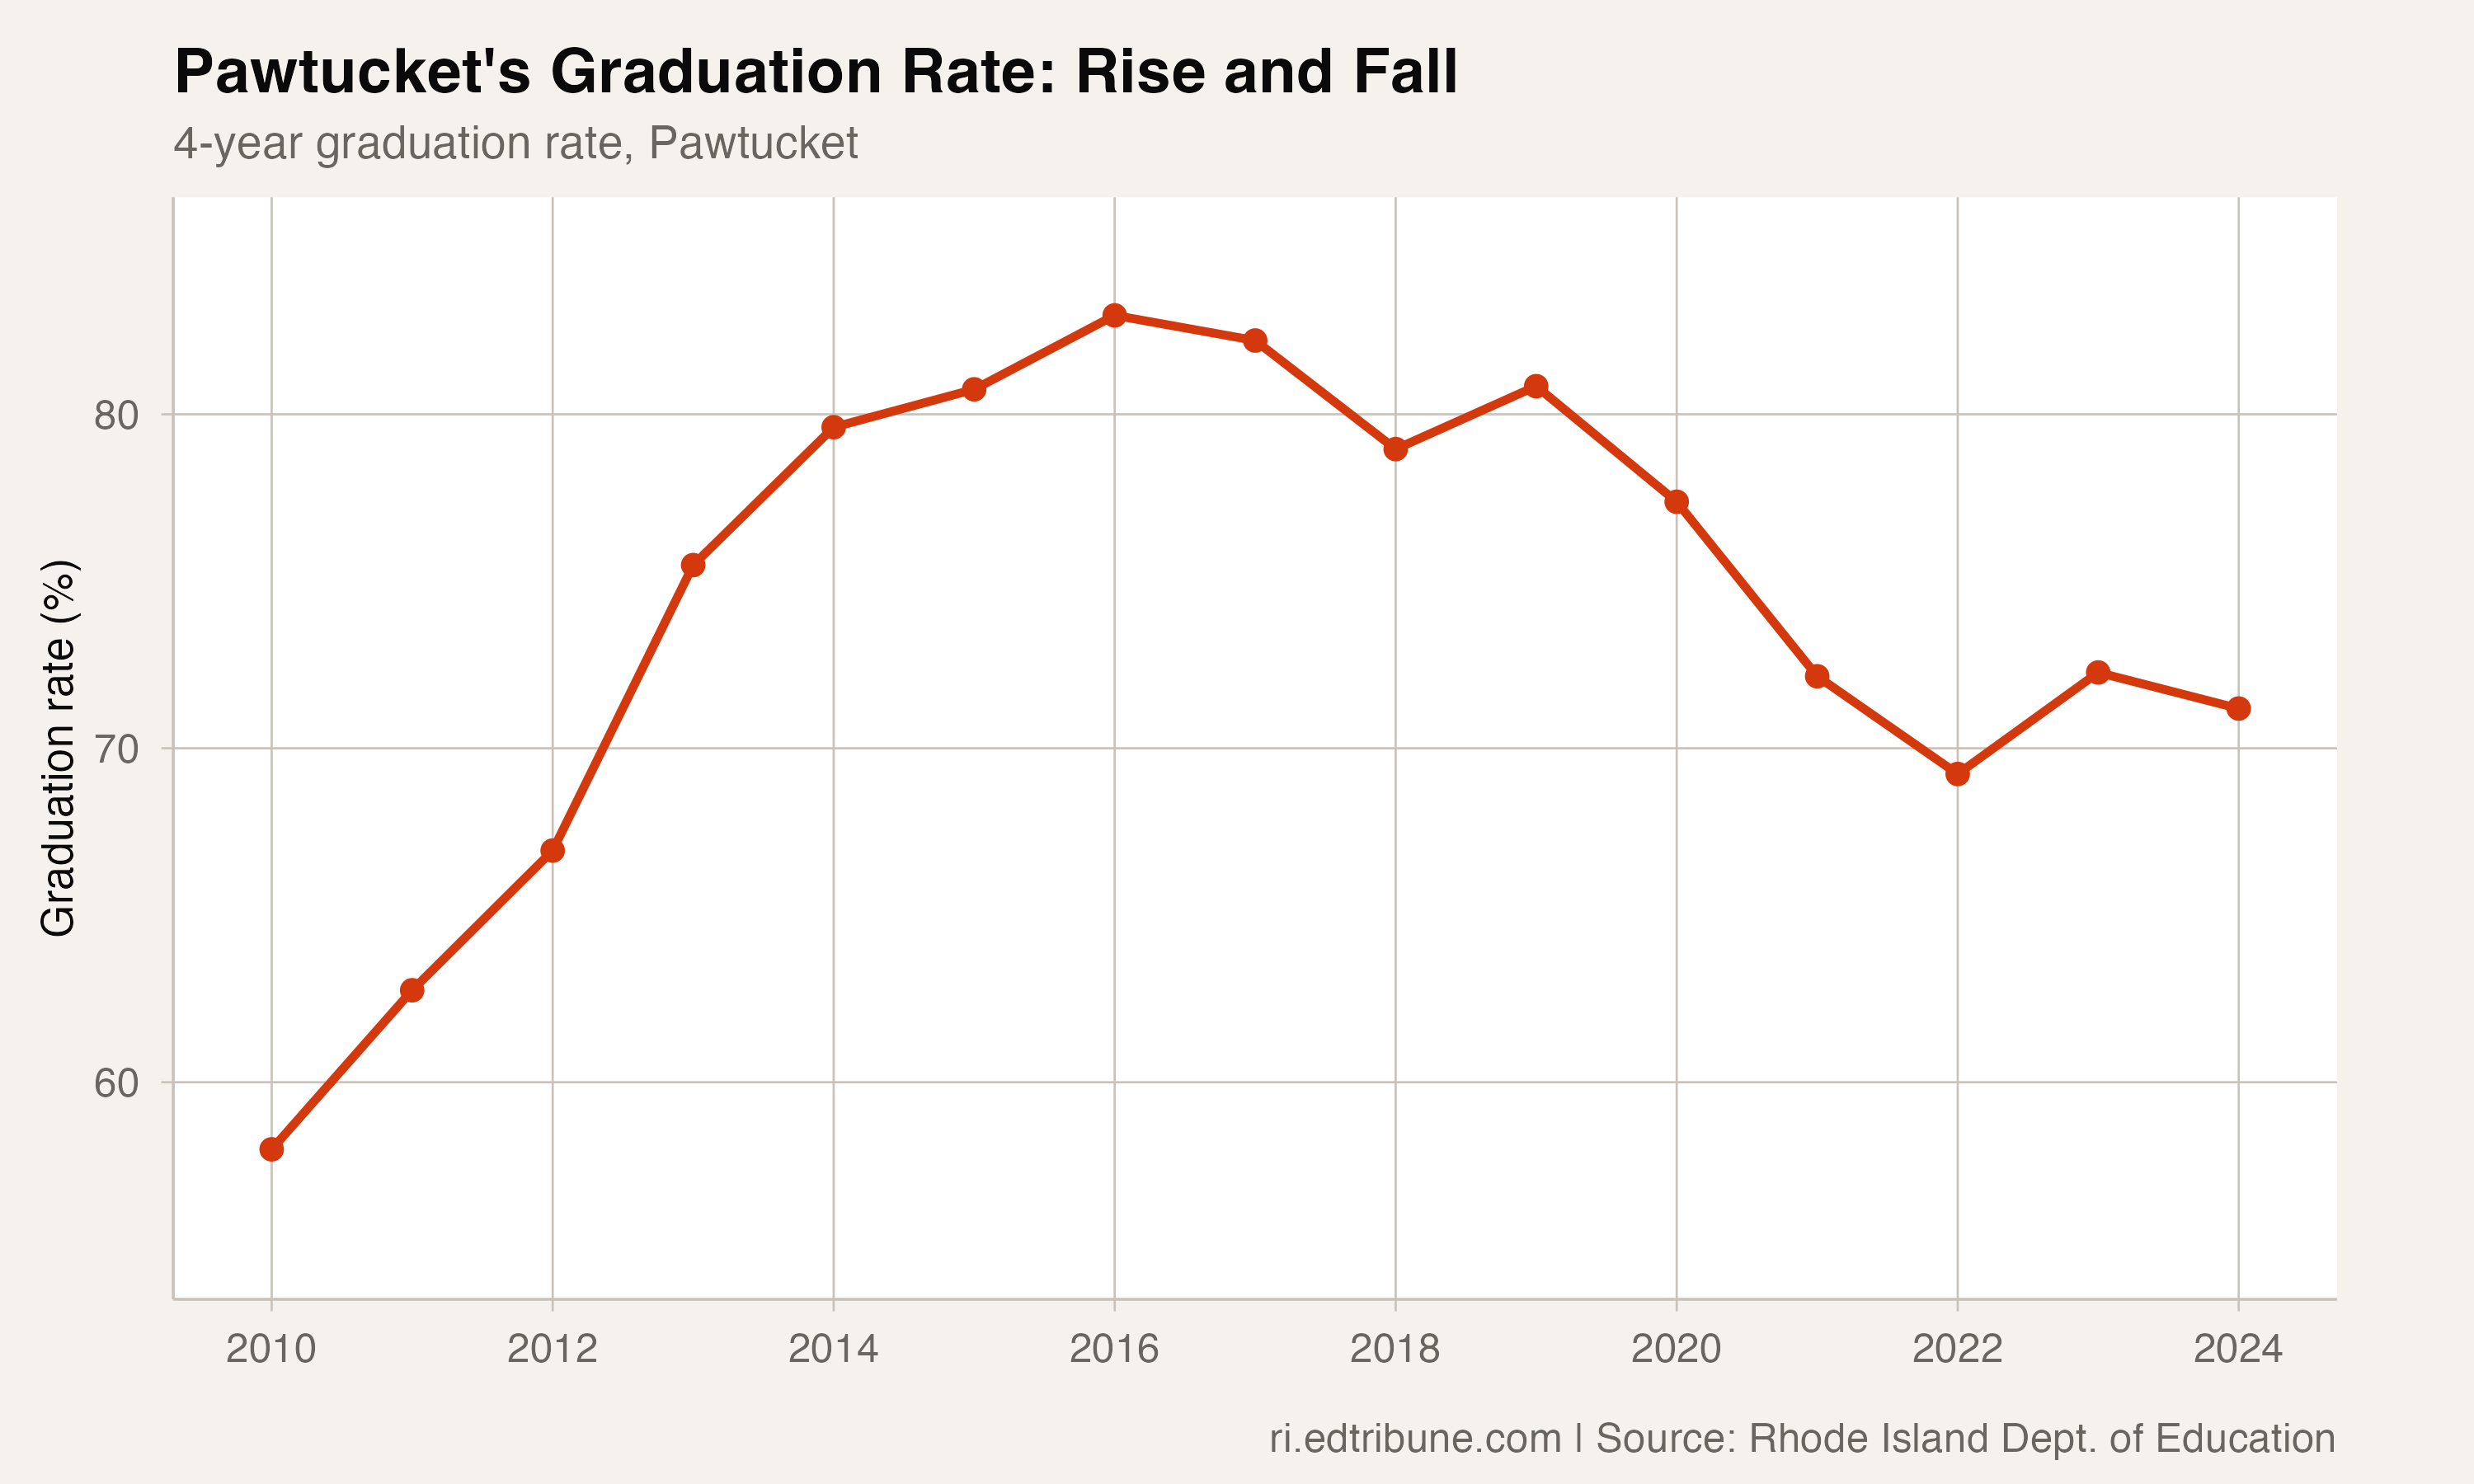
Pawtucket↗ET was once one of Rhode Island's clearest graduation-rate turnaround stories. From 58.0 percent in 2010 to 83.0 percent in 2016, the district's graduation rate climbed 25 points in six years — the second-largest improvement among Rhode Island districts with data in both years.
Eight years later, the rate is 71.2 percent. The 11.8-point decline from the 2016 peak has returned the district to approximately where it stood in 2013. Among Rhode Island districts with 2024 cohorts of at least 500 students, Pawtucket had the highest dropout rate at 19.0 percent.
Rise and fall
The numbers define two eras. From 2010 to 2016, Pawtucket's graduation rate increased every year but one, rising from 58.0 to 62.8, 66.9, 75.5, 79.6, 80.7, and 83.0 percent.
The decline was not immediate. The rate held at 82.2 in 2017, dipped to 79.0 in 2018, and partially recovered to 80.8 in 2019. Then the floor collapsed: 77.4 in 2020, 72.2 in 2021, 69.2 in 2022. A modest recovery to 72.3 in 2023 proved temporary — the 2024 rate dropped back to 71.2 percent.
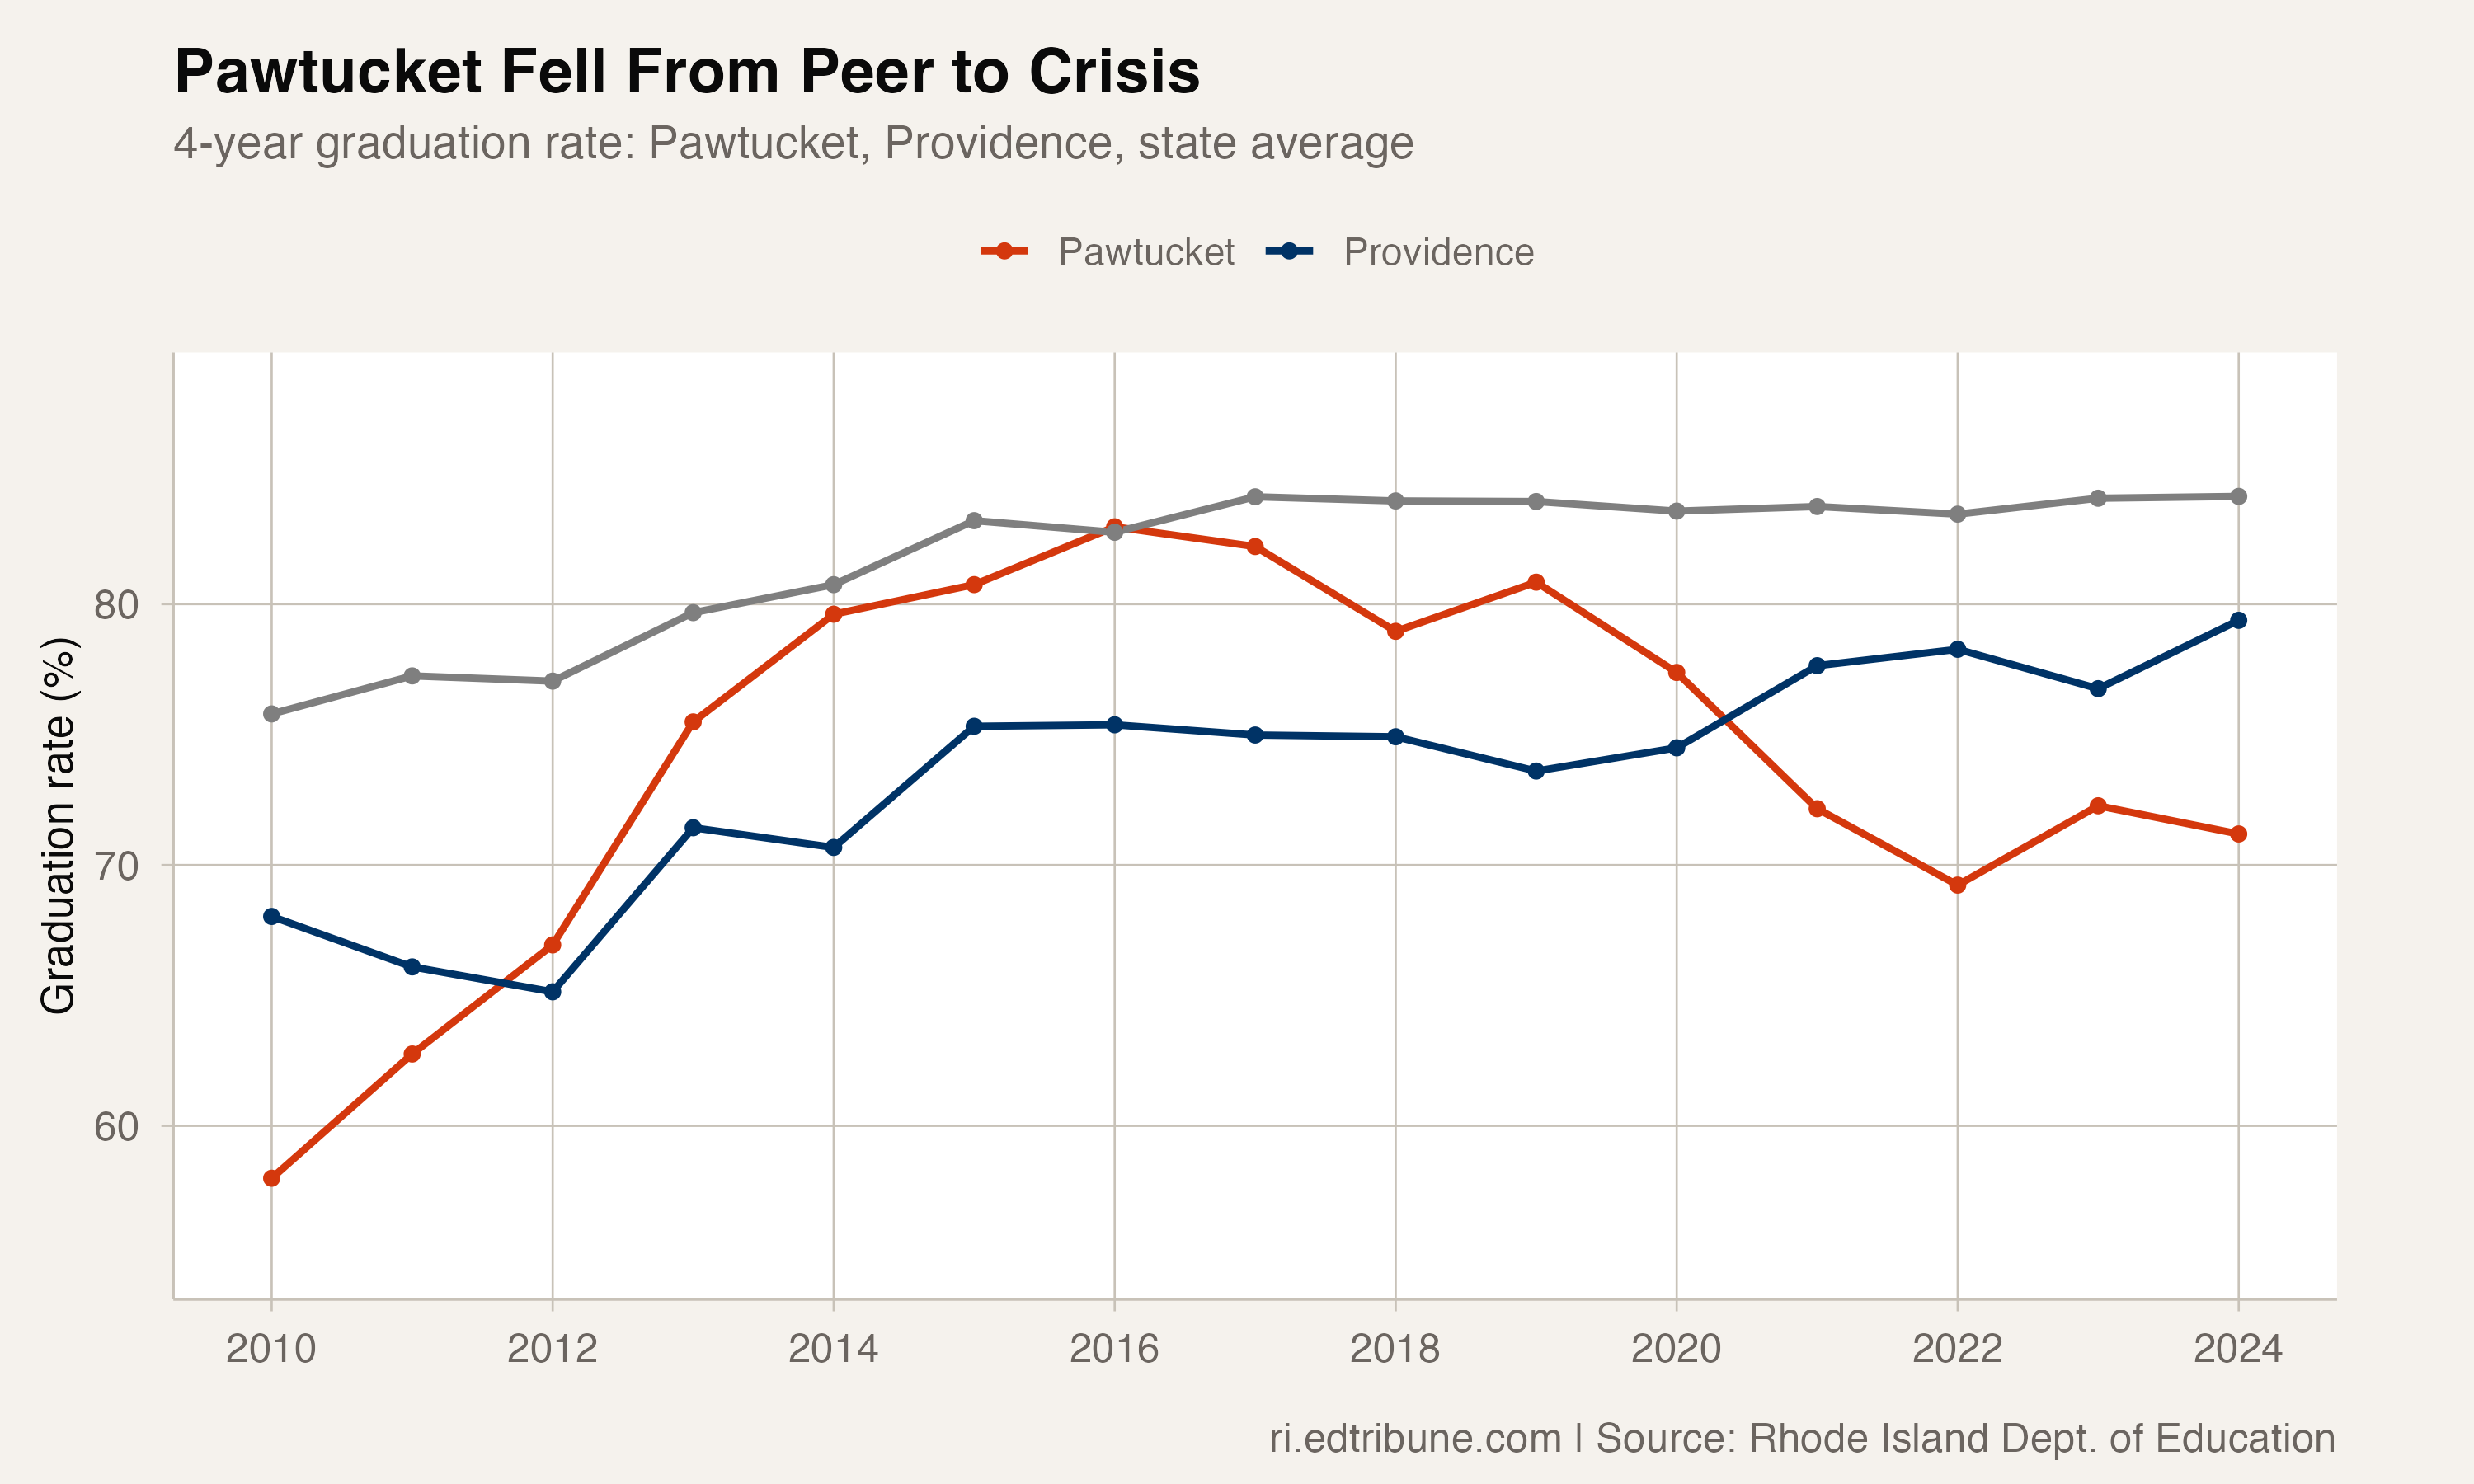
The contrast with Providence↗ET is particularly striking. In 2016, Pawtucket's rate (83.0 percent) exceeded Providence's (75.4 percent) by 7.6 points. By 2024, Providence (79.4 percent) leads Pawtucket (71.2 percent) by 8.2 points. The positions have reversed entirely.
The dropout surge
The most alarming feature of Pawtucket's decline is the dropout rate. At 19.0 percent in 2024, nearly one in five students in the four-year cohort dropped out entirely. The rate had fallen to 9.1 percent by 2014 — less than half the 2024 figure.
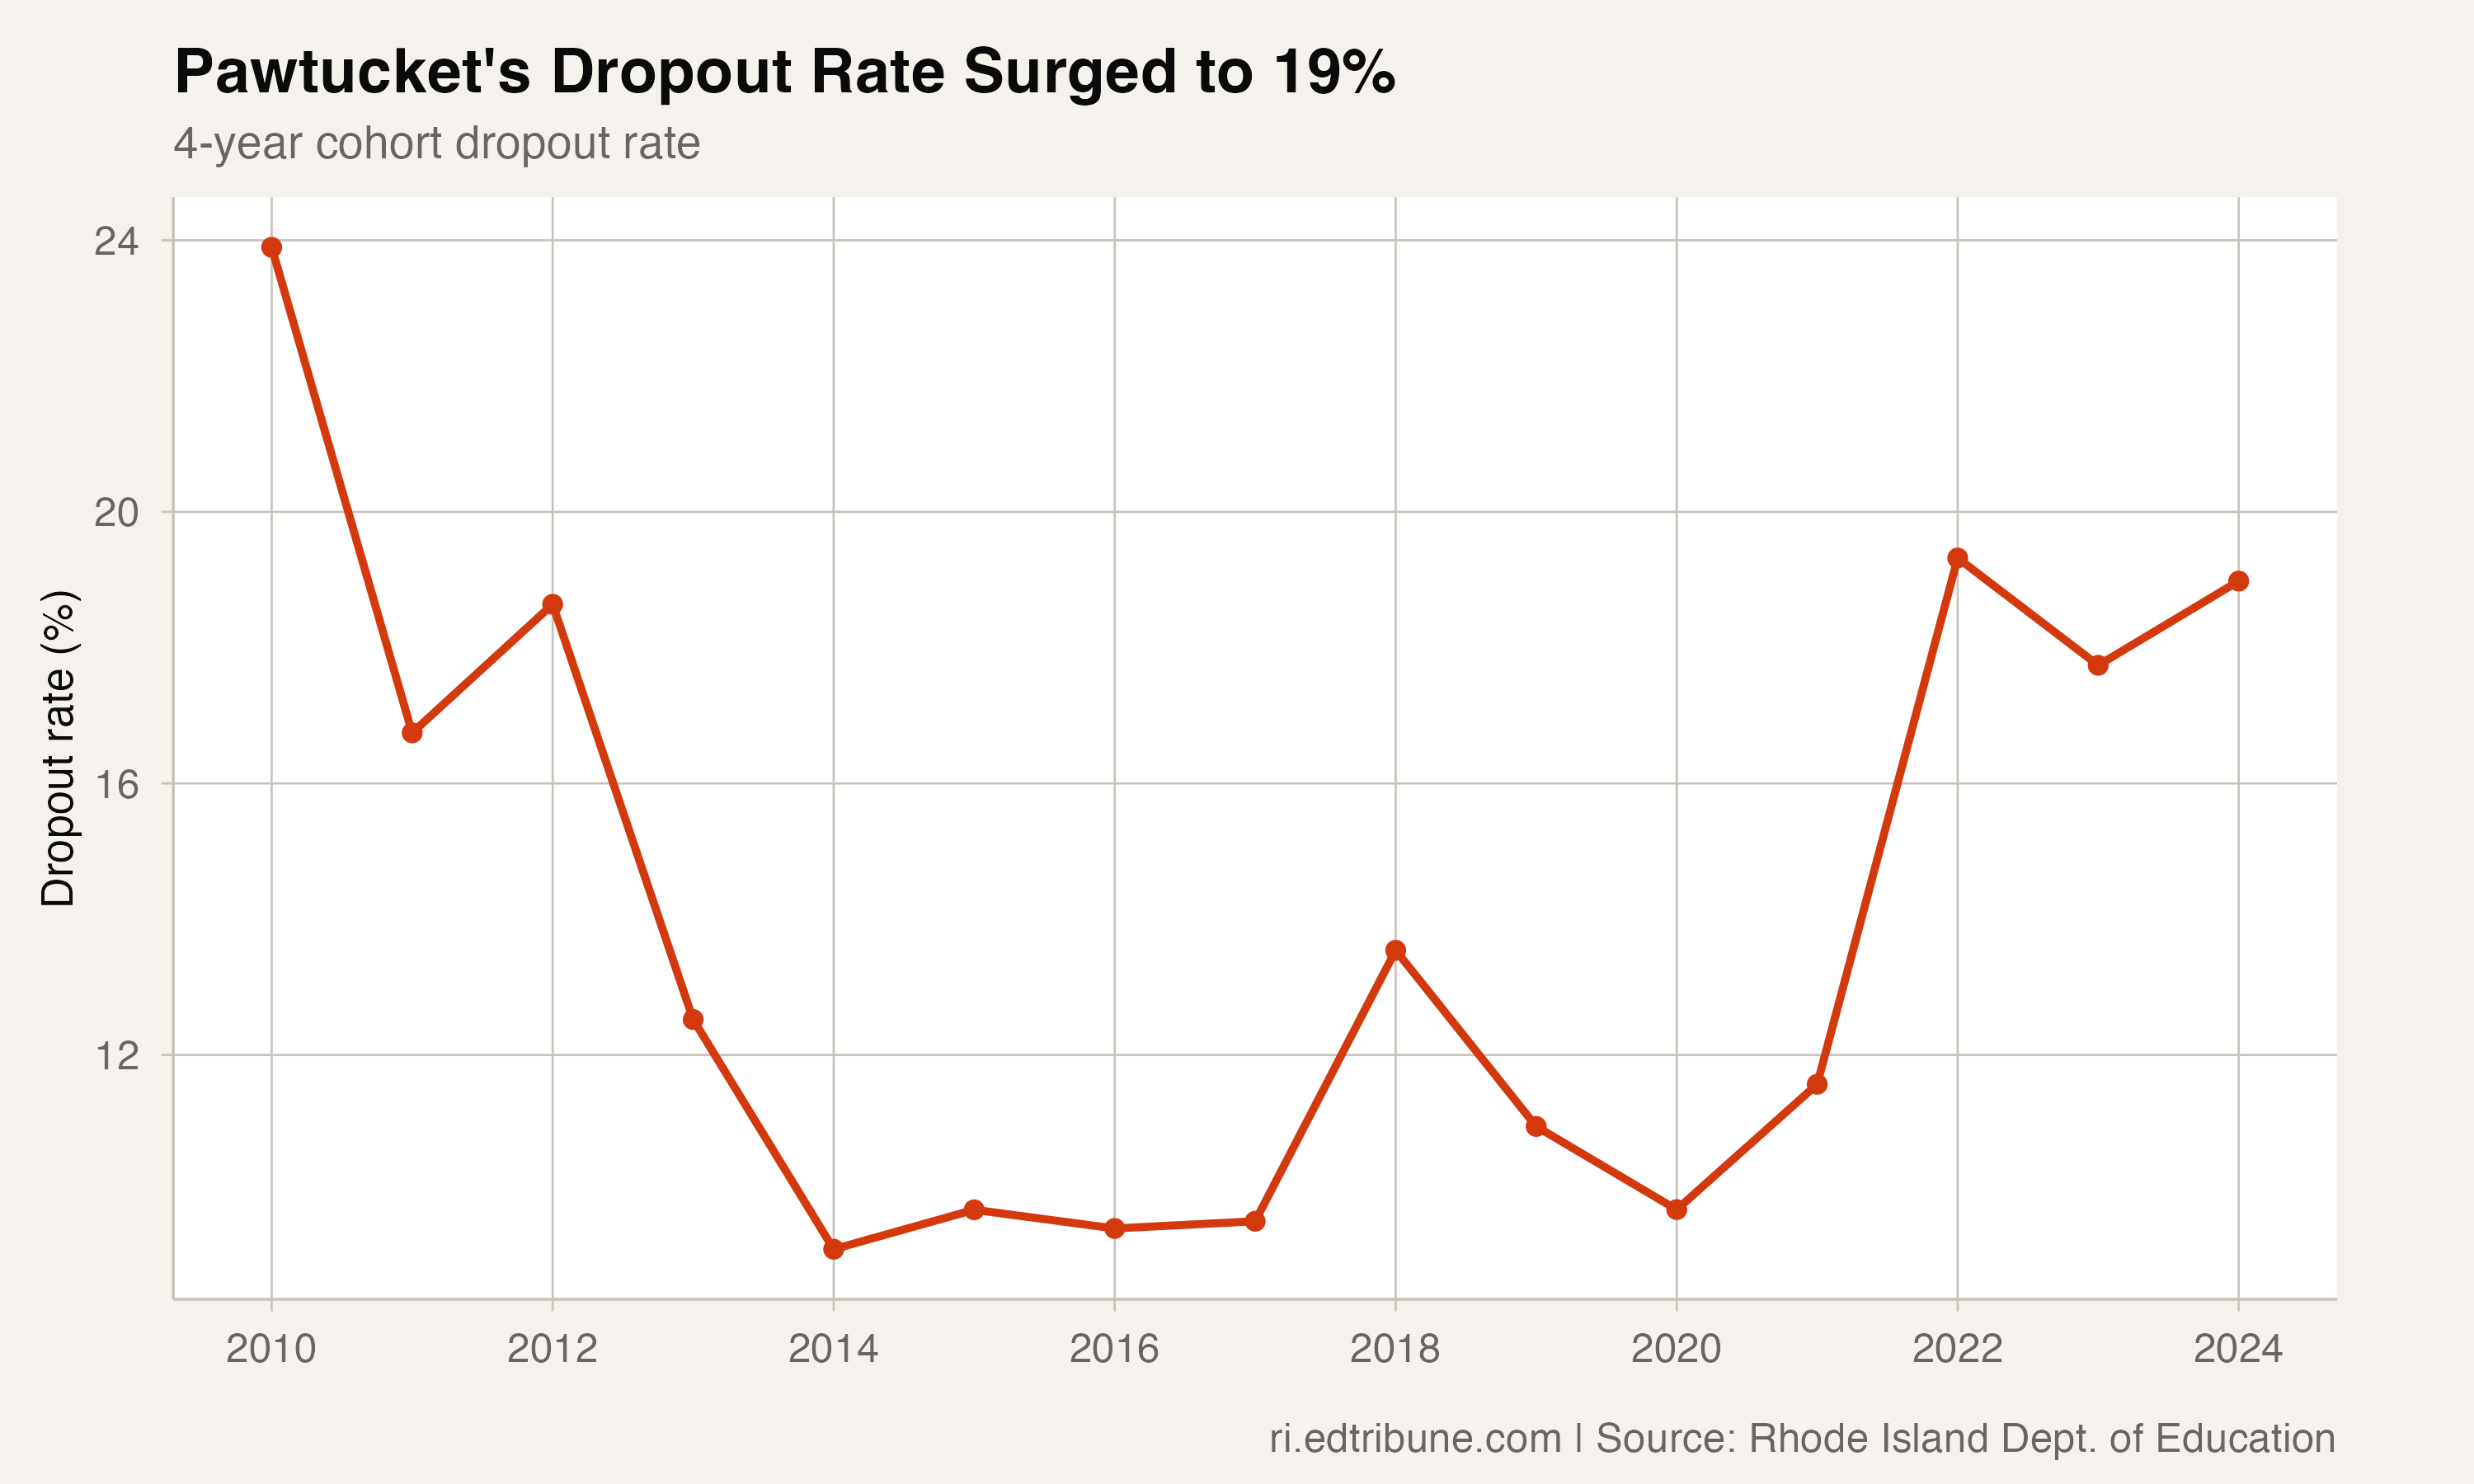
For a 590-student cohort, 19.0 percent means roughly 112 students dropped out. Another 58 or so neither graduated nor dropped out — they were retained, transferred, or left the system without formal documentation. Combined with the 170 who did not graduate on time, Pawtucket's 2024 cohort produced roughly 420 graduates and 170 non-graduates.
What the data can and cannot show
Pawtucket shares the bottom tier of Rhode Island's graduation-rate distribution with Central Falls and Woonsocket. In 2024, Central Falls graduated 58.7 percent of its four-year cohort, Woonsocket graduated 61.8 percent, and Pawtucket graduated 71.2 percent.
The graduation file shows where students ended up. It does not show which district practices changed, which students transferred, or which supports reached students before they dropped out. That makes the reversal visible but not fully explained.
The contrast with Providence is still useful because the data move in opposite directions. Providence's graduation rate was lower than Pawtucket's in 2016 and higher than Pawtucket's in 2024. Pawtucket fell from 83.0 percent to 71.2 percent; Providence rose from 75.4 percent to 79.4 percent.
What the turnaround era achieved and lost
The 2010-2016 turnaround was real in the data. The district moved from 58.0 percent to 83.0 percent, a 25-point gain. The 2016 cohort had 92 students who did not graduate on time; the 2010 cohort had 276.
The loss was also real. In 2024, Pawtucket had 170 students who did not graduate on time, nearly double the 2016 count despite a cohort only 50 students larger.
Pawtucket's story is a warning about how fragile a graduation-rate recovery can be. A district can build a years-long climb, hold most of it for a while, and still slide back toward its pre-turnaround level if the next cohorts do not sustain the same progress.
Detailed code that reproduces the analysis and figures in this article is available exclusively to EdTribune subscribers.
Discussion
Sign in to join the discussion.
Loading comments...