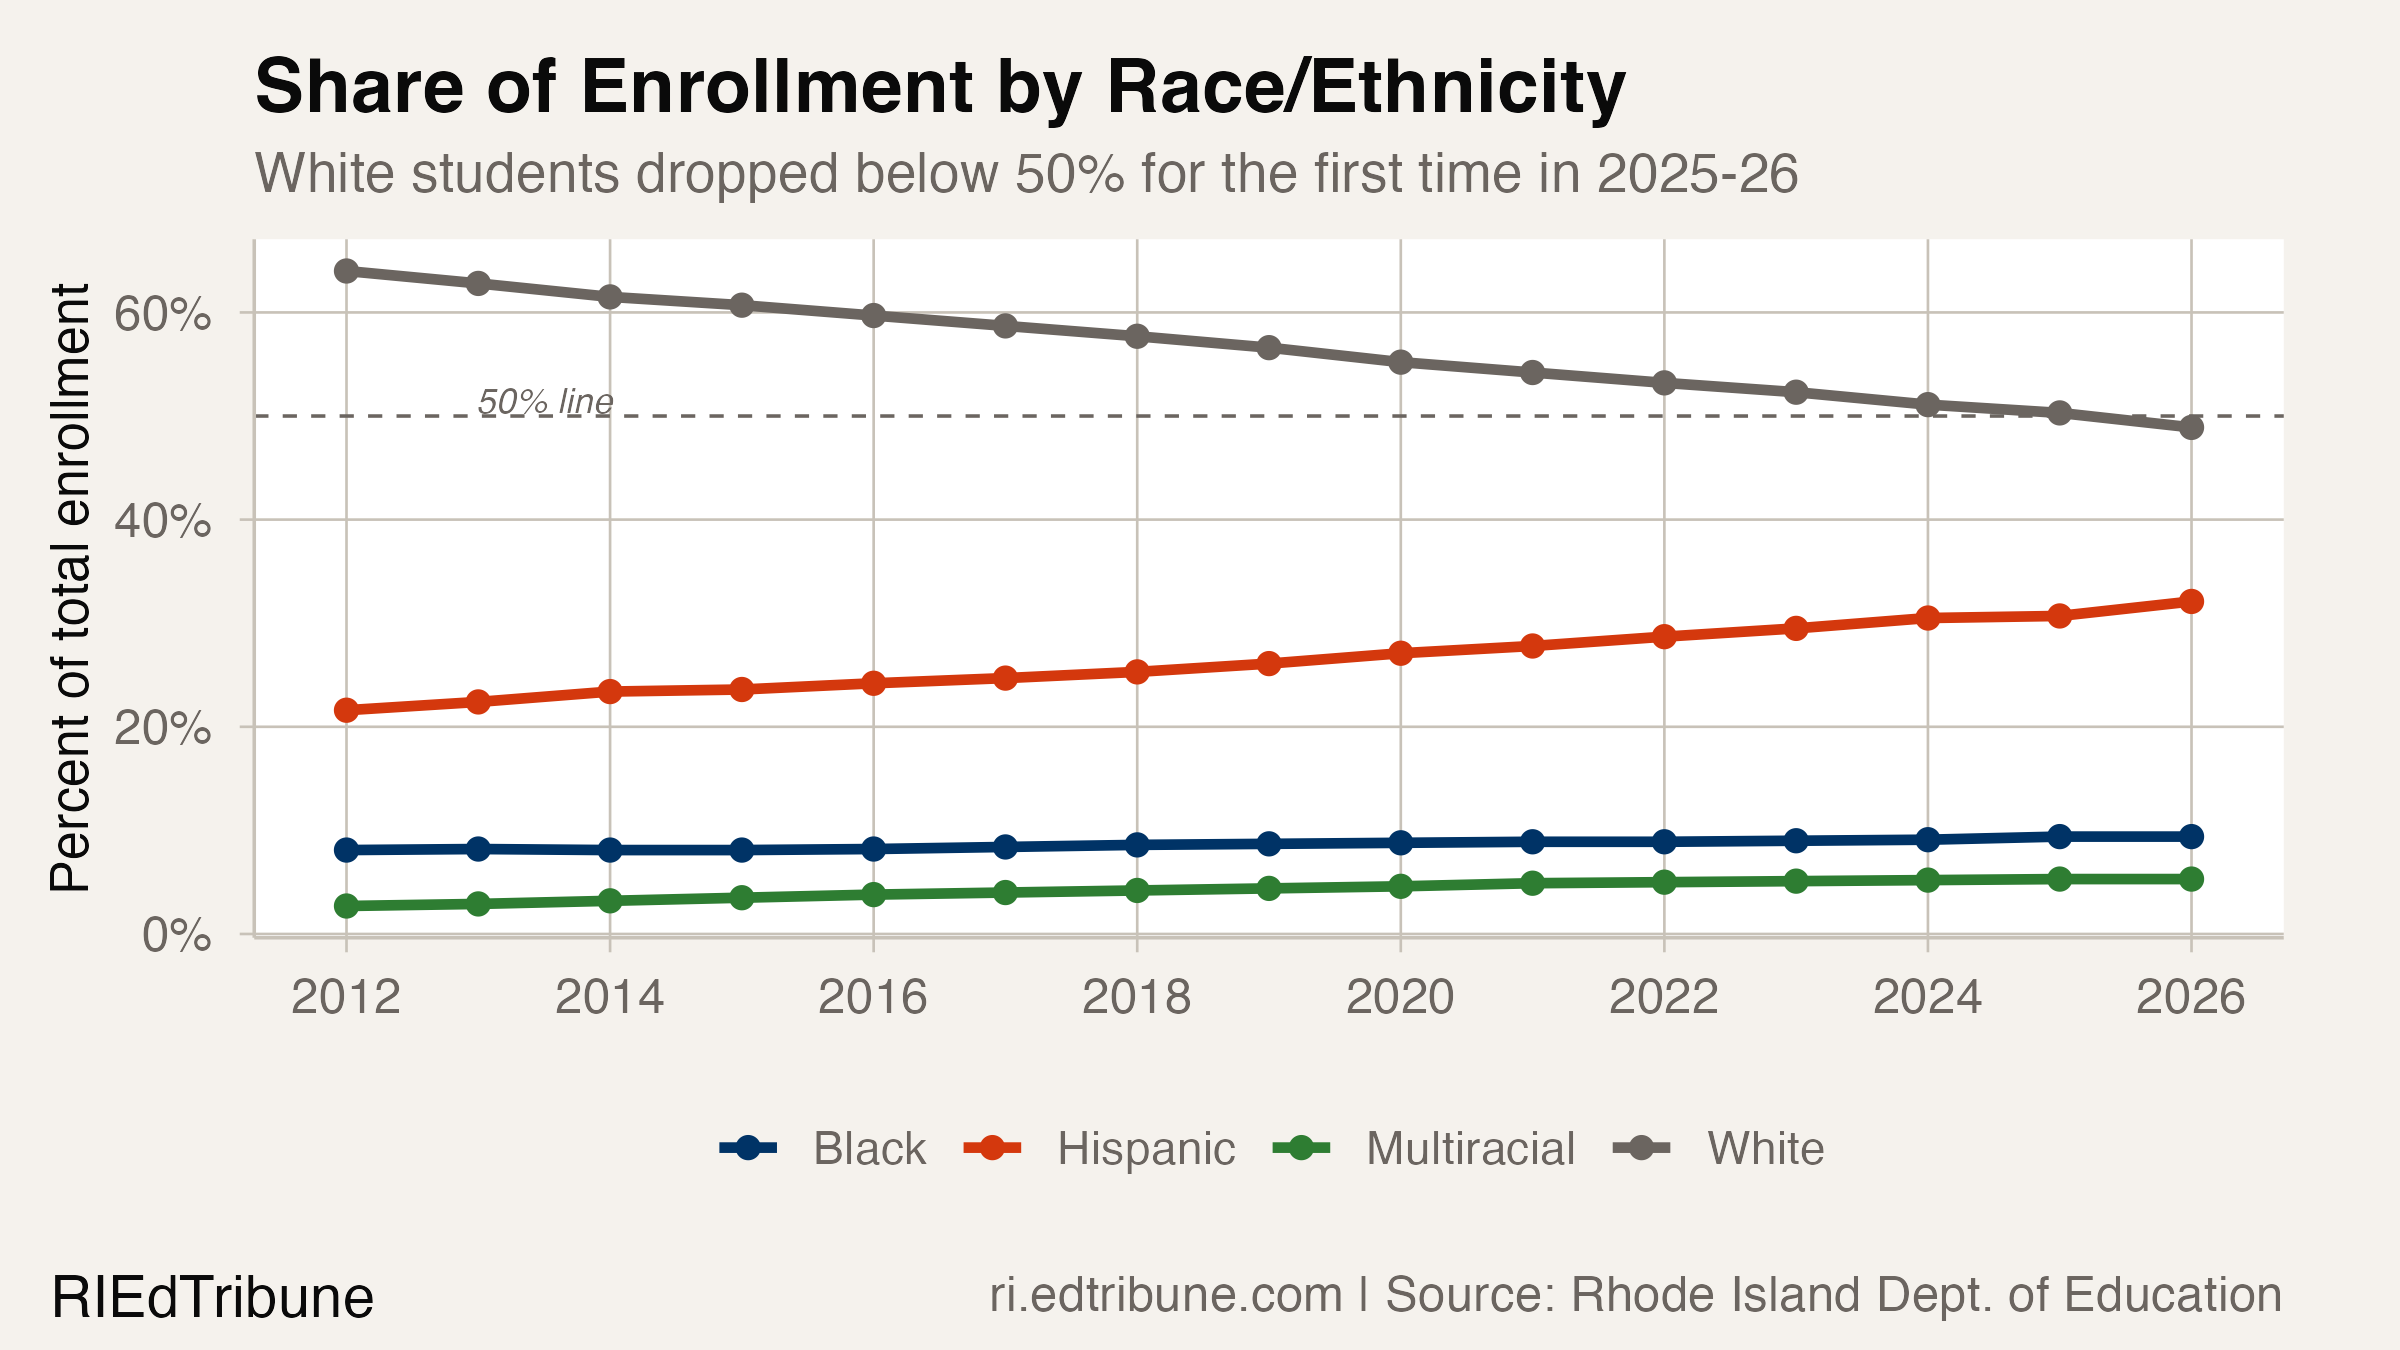
For the first time in state history, white students are no longer the majority in Rhode Island's public schools. White enrollment fell to 48.9% of the student body in 2025-26, down from 50.3% last year and 64.0% in 2011-12 — a 15.1 percentage-point drop in 14 years. The shift did not require a surge in students of color. It happened because white enrollment has fallen faster than every other group, shedding 2,935 students this year alone while overall enrollment dropped 2,149.
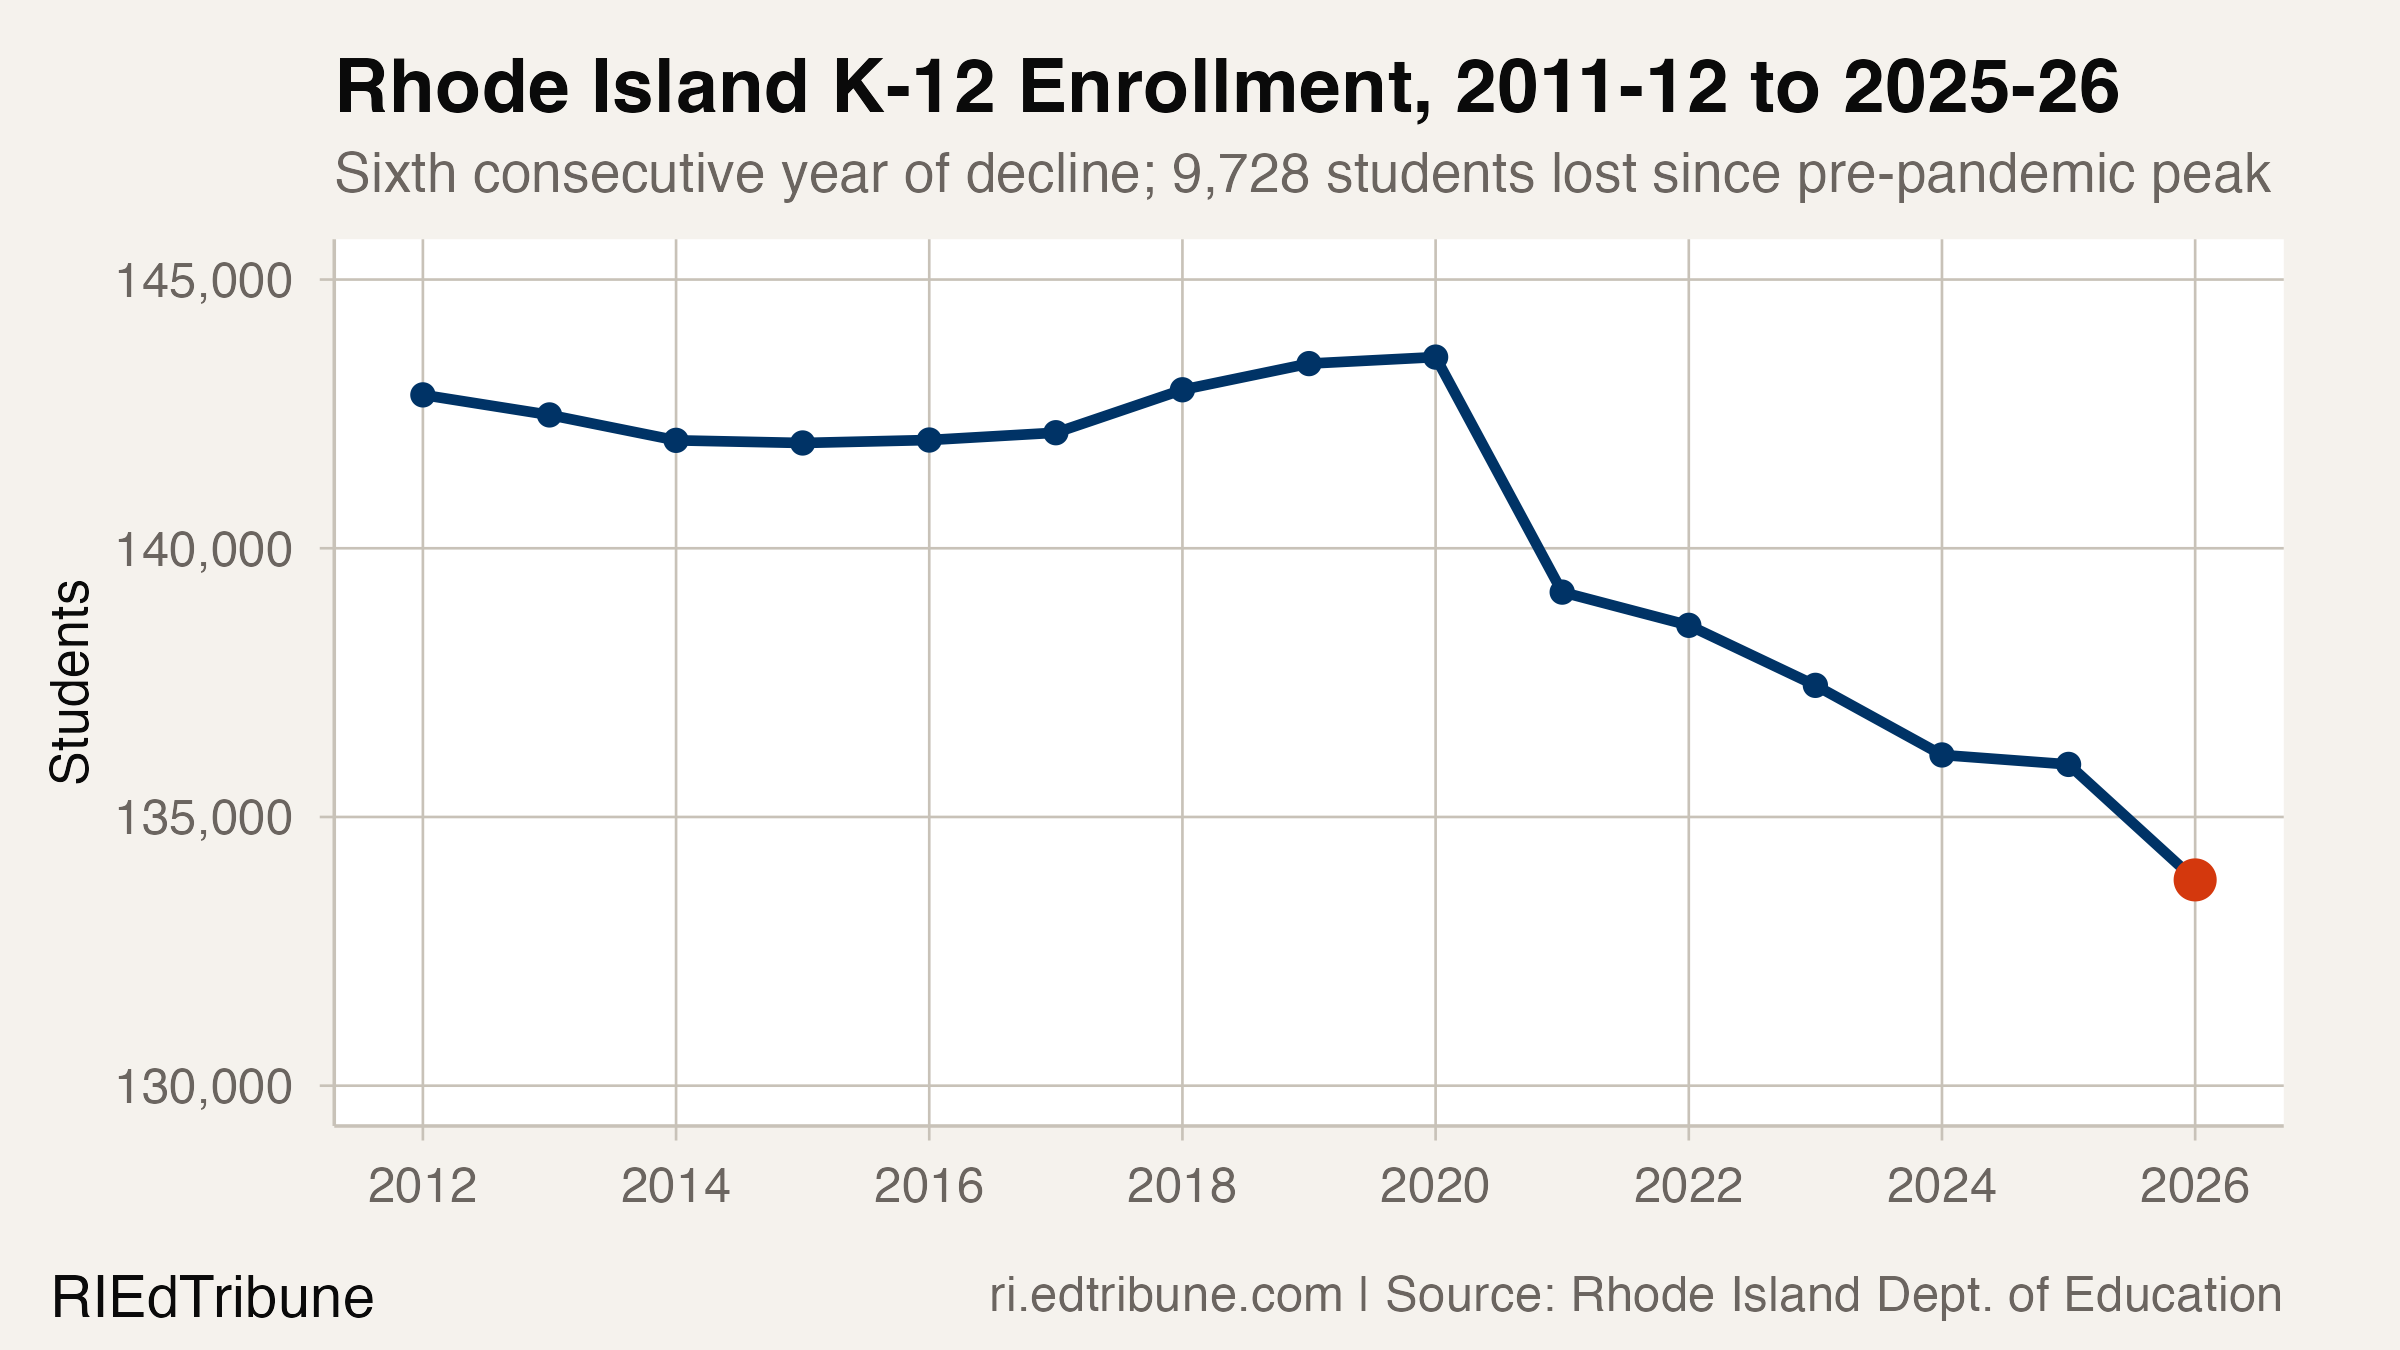
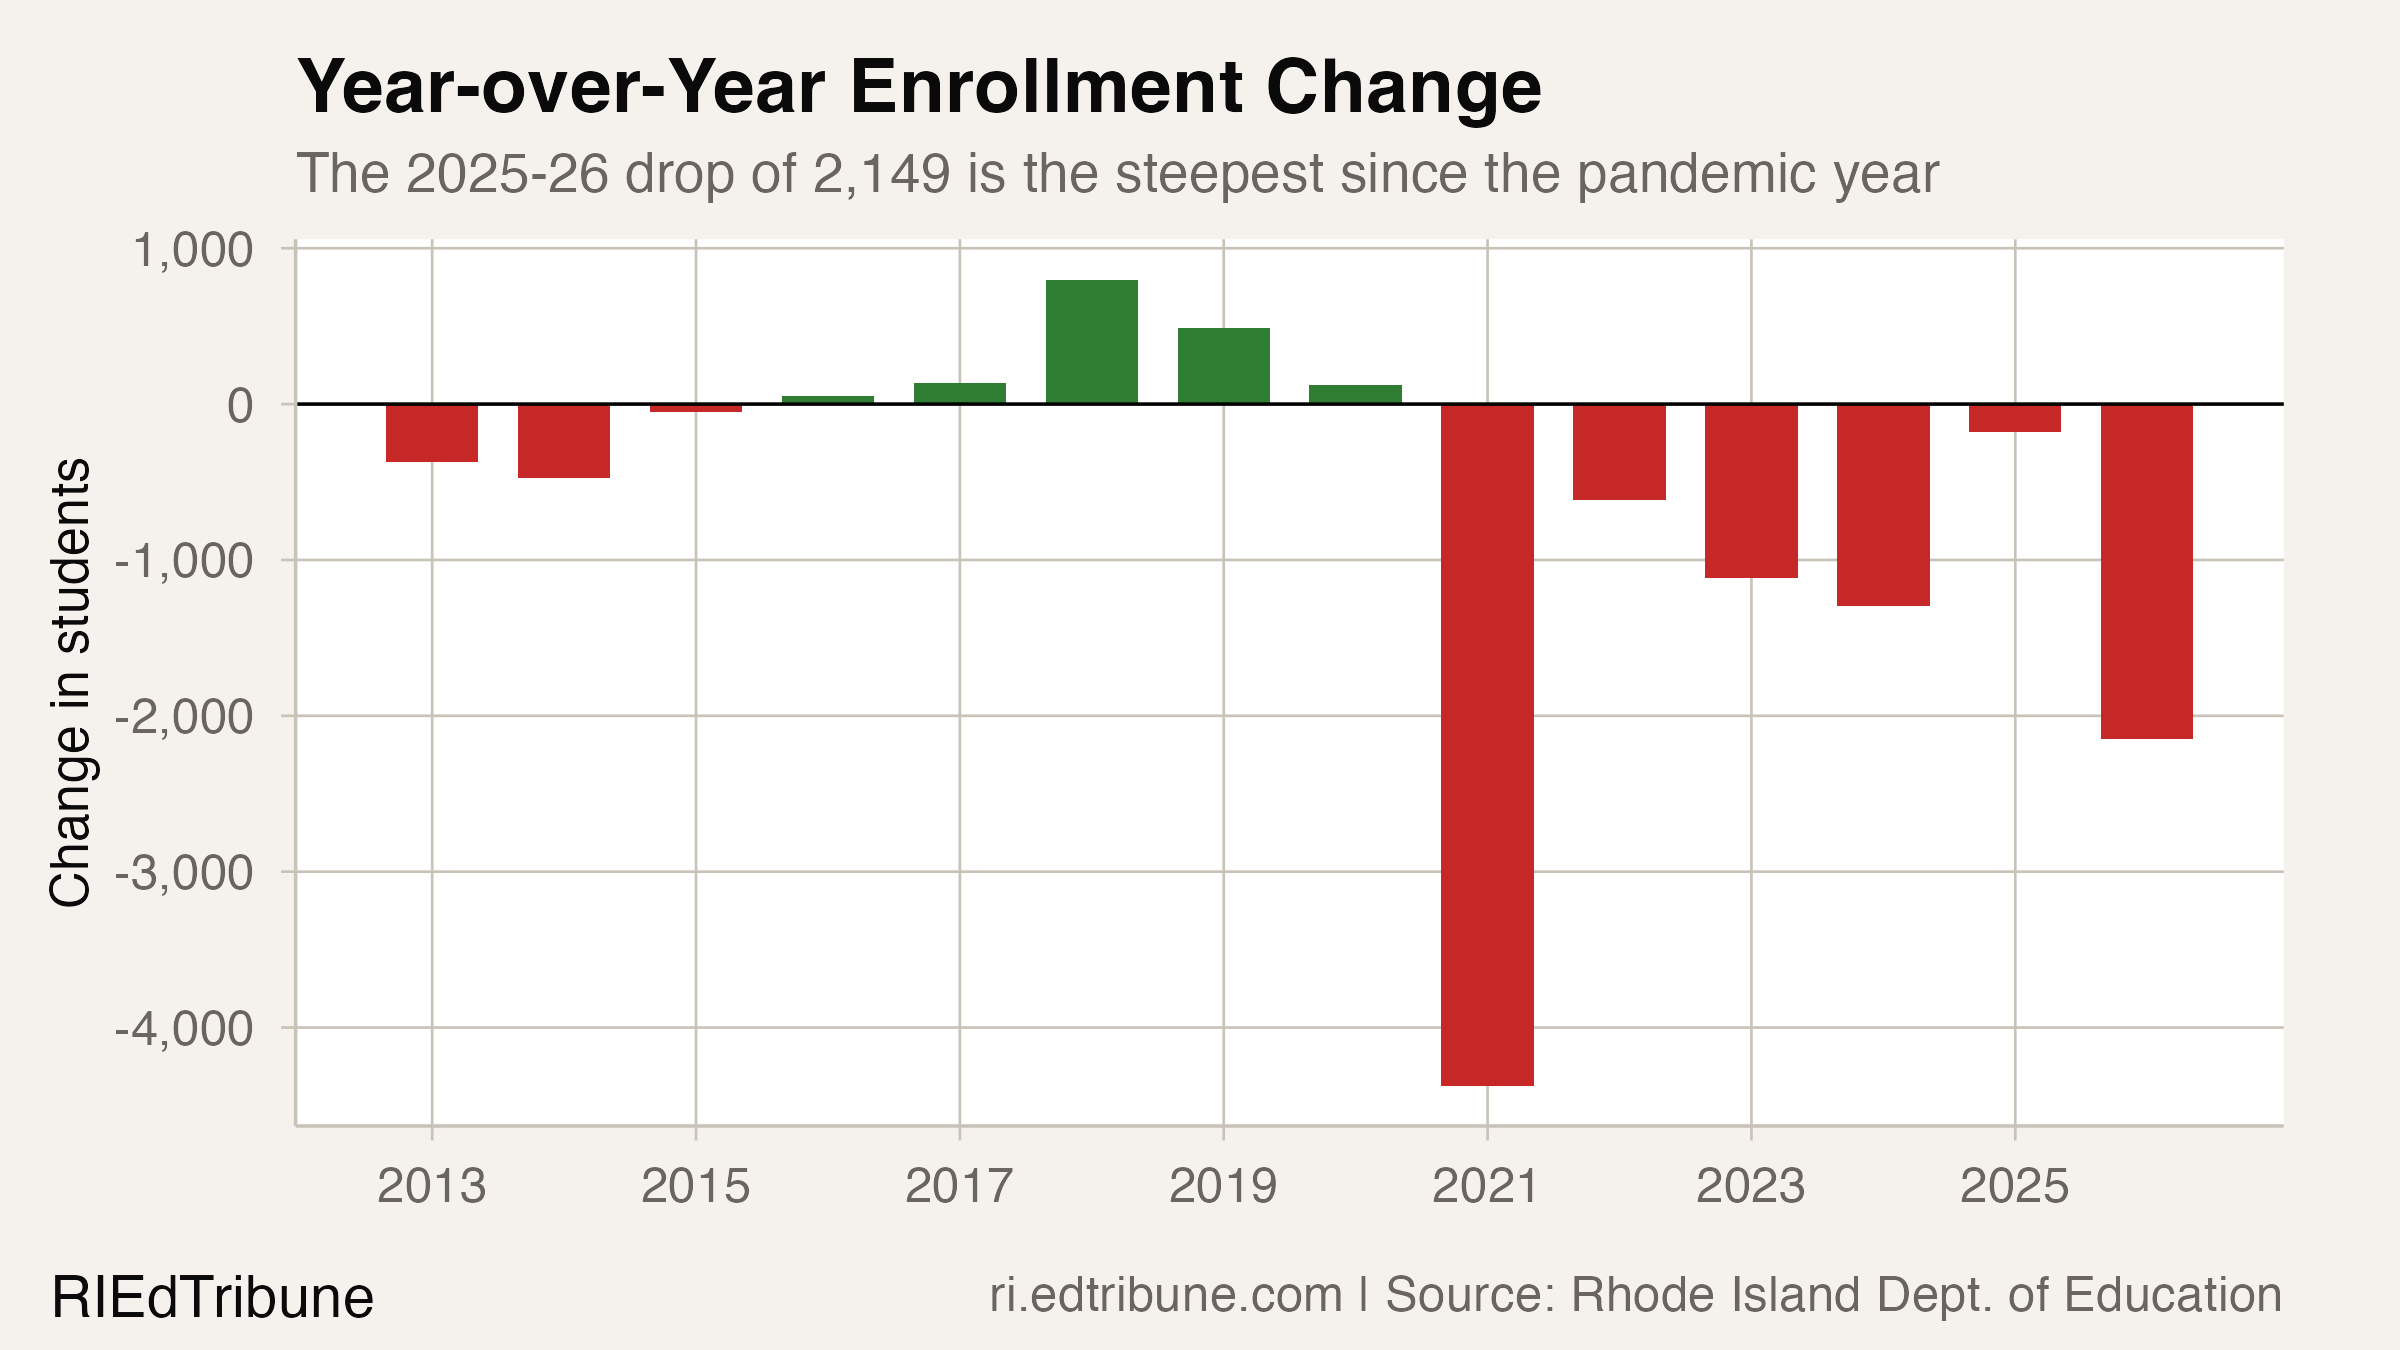
That overall decline — from 135,978 to 133,829, or 1.6% — is the steepest single-year loss since the pandemic cratered enrollment by 4,373 in 2020-21. Last year's loss of just 176 students had suggested the state might be approaching a floor. It was not.
The pattern
Rhode Island's enrollment story has three chapters. From 2011-12 through 2014-15, the state slowly lost students, falling from 143,793 to 141,959. Then came a five-year recovery: enrollment climbed back to 143,557 by 2019-20, nearly matching the decade's starting point.
The pandemic erased that recovery in a single year. What followed has been worse — not the sharp shock of 2020-21, but six consecutive years of decline. The 2024-25 figure of 135,978 had looked like a possible plateau, with only 176 students lost. This year's 2,149-student drop ended that. The state has now lost 9,728 students since 2019-20 — 6.8% of its enrollment.
The demographic composition has shifted even more than the topline. White enrollment fell from 91,400 to 65,496 over 14 years — a loss of 25,904 students, more than twice the total enrollment decline. Hispanic enrollment partially offset this, rising from 30,816 (21.6%) to 42,974 (32.1%). Multiracial students nearly doubled their share, from 2.7% to 5.3%.
| Group | 2011-12 | 2025-26 | Change |
|---|---|---|---|
| White | 64.0% | 48.9% | -15.1 pp |
| Hispanic | 21.6% | 32.1% | +10.5 pp |
| Black | 8.1% | 9.4% | +1.3 pp |
| Multiracial | 2.7% | 5.3% | +2.6 pp |
| Asian | 2.9% | 3.2% | +0.3 pp |
Why this may be happening
The most direct driver of the enrollment decline is demographic: Rhode Island's birth rate has fallen steadily, and the state's population is aging. Education Commissioner Angélica Infante-Green told NBC 10 that "the birth rate is down nationally, and parents are making different decisions." State population projections place Rhode Island among the states expected to shrink through 2040. The white student population, drawn from a cohort with particularly steep birth-rate declines, has contracted the fastest.
A second factor is school choice. Charter applications in Rhode Island far outpace available seats — 11,000 applications for roughly 2,500 openings, according to the Rhode Island League of Charter Schools. Every district in the top five enrollment gainers this year is a charter school. But charter enrollment is a zero-sum redistribution within public education, not a net loss. The five top-gaining charters added a combined 420 students; Providence alone lost 426.
A third possibility — families leaving for private schools or homeschooling — lacks direct data. Rhode Island does not publish a comprehensive private school enrollment count alongside its public data, making it impossible to quantify this pathway from state sources.
What reporting suggests
Local outlets have connected the enrollment decline to budget and infrastructure pressures. Rep. Megan Cotter, who introduced legislation to triple state funding for districts that regionalize, framed the trend as unsustainable:
"We can't keep asking towns to raise their property taxes to fund education. It's not sustainable." — Ocean State Media, Jan 2025
Commissioner Infante-Green has endorsed consolidation as an eventual necessity, noting the mismatch between small districts and shrinking enrollment:
"It doesn't make sense sometimes to have two elementary schools and two districts side-by-side that are half empty." — Ocean State Media, Jan 2025
The state's own enrollment data has also become a source of friction. A discrepancy between October 2024 counts and March 2025 updates left school funding estimates off by $24 million, with the error concentrated in English learner and economically disadvantaged counts — exactly the populations whose instructional programs carry the highest per-pupil costs.
What we don't know
The most striking anomaly in this year's data is what happened to English learner growth. After gaining 1,930 students the prior year — part of a 13-year run that lifted EL enrollment 141% from 8,436 to 20,352 — the count essentially froze, adding just seven students to reach 20,359. Whether that reflects a genuine plateau in new arrivals, expanded reclassification moving students out of EL status, or a data-timing artifact in the October count is not clear from the published numbers. RIDE's own finance director told state legislators that "the October data hasn't been great the last few years," and March updates have shown materially different EL counts.
The white enrollment drop is also steeper than overall decline can explain. The state lost 2,149 students total but 2,935 white students — meaning growth in other groups partially masked the decline. Without private school enrollment data, it is impossible to determine how much of the white student loss reflects lower birth rates, outmigration from the state, or transfers to private and parochial schools.
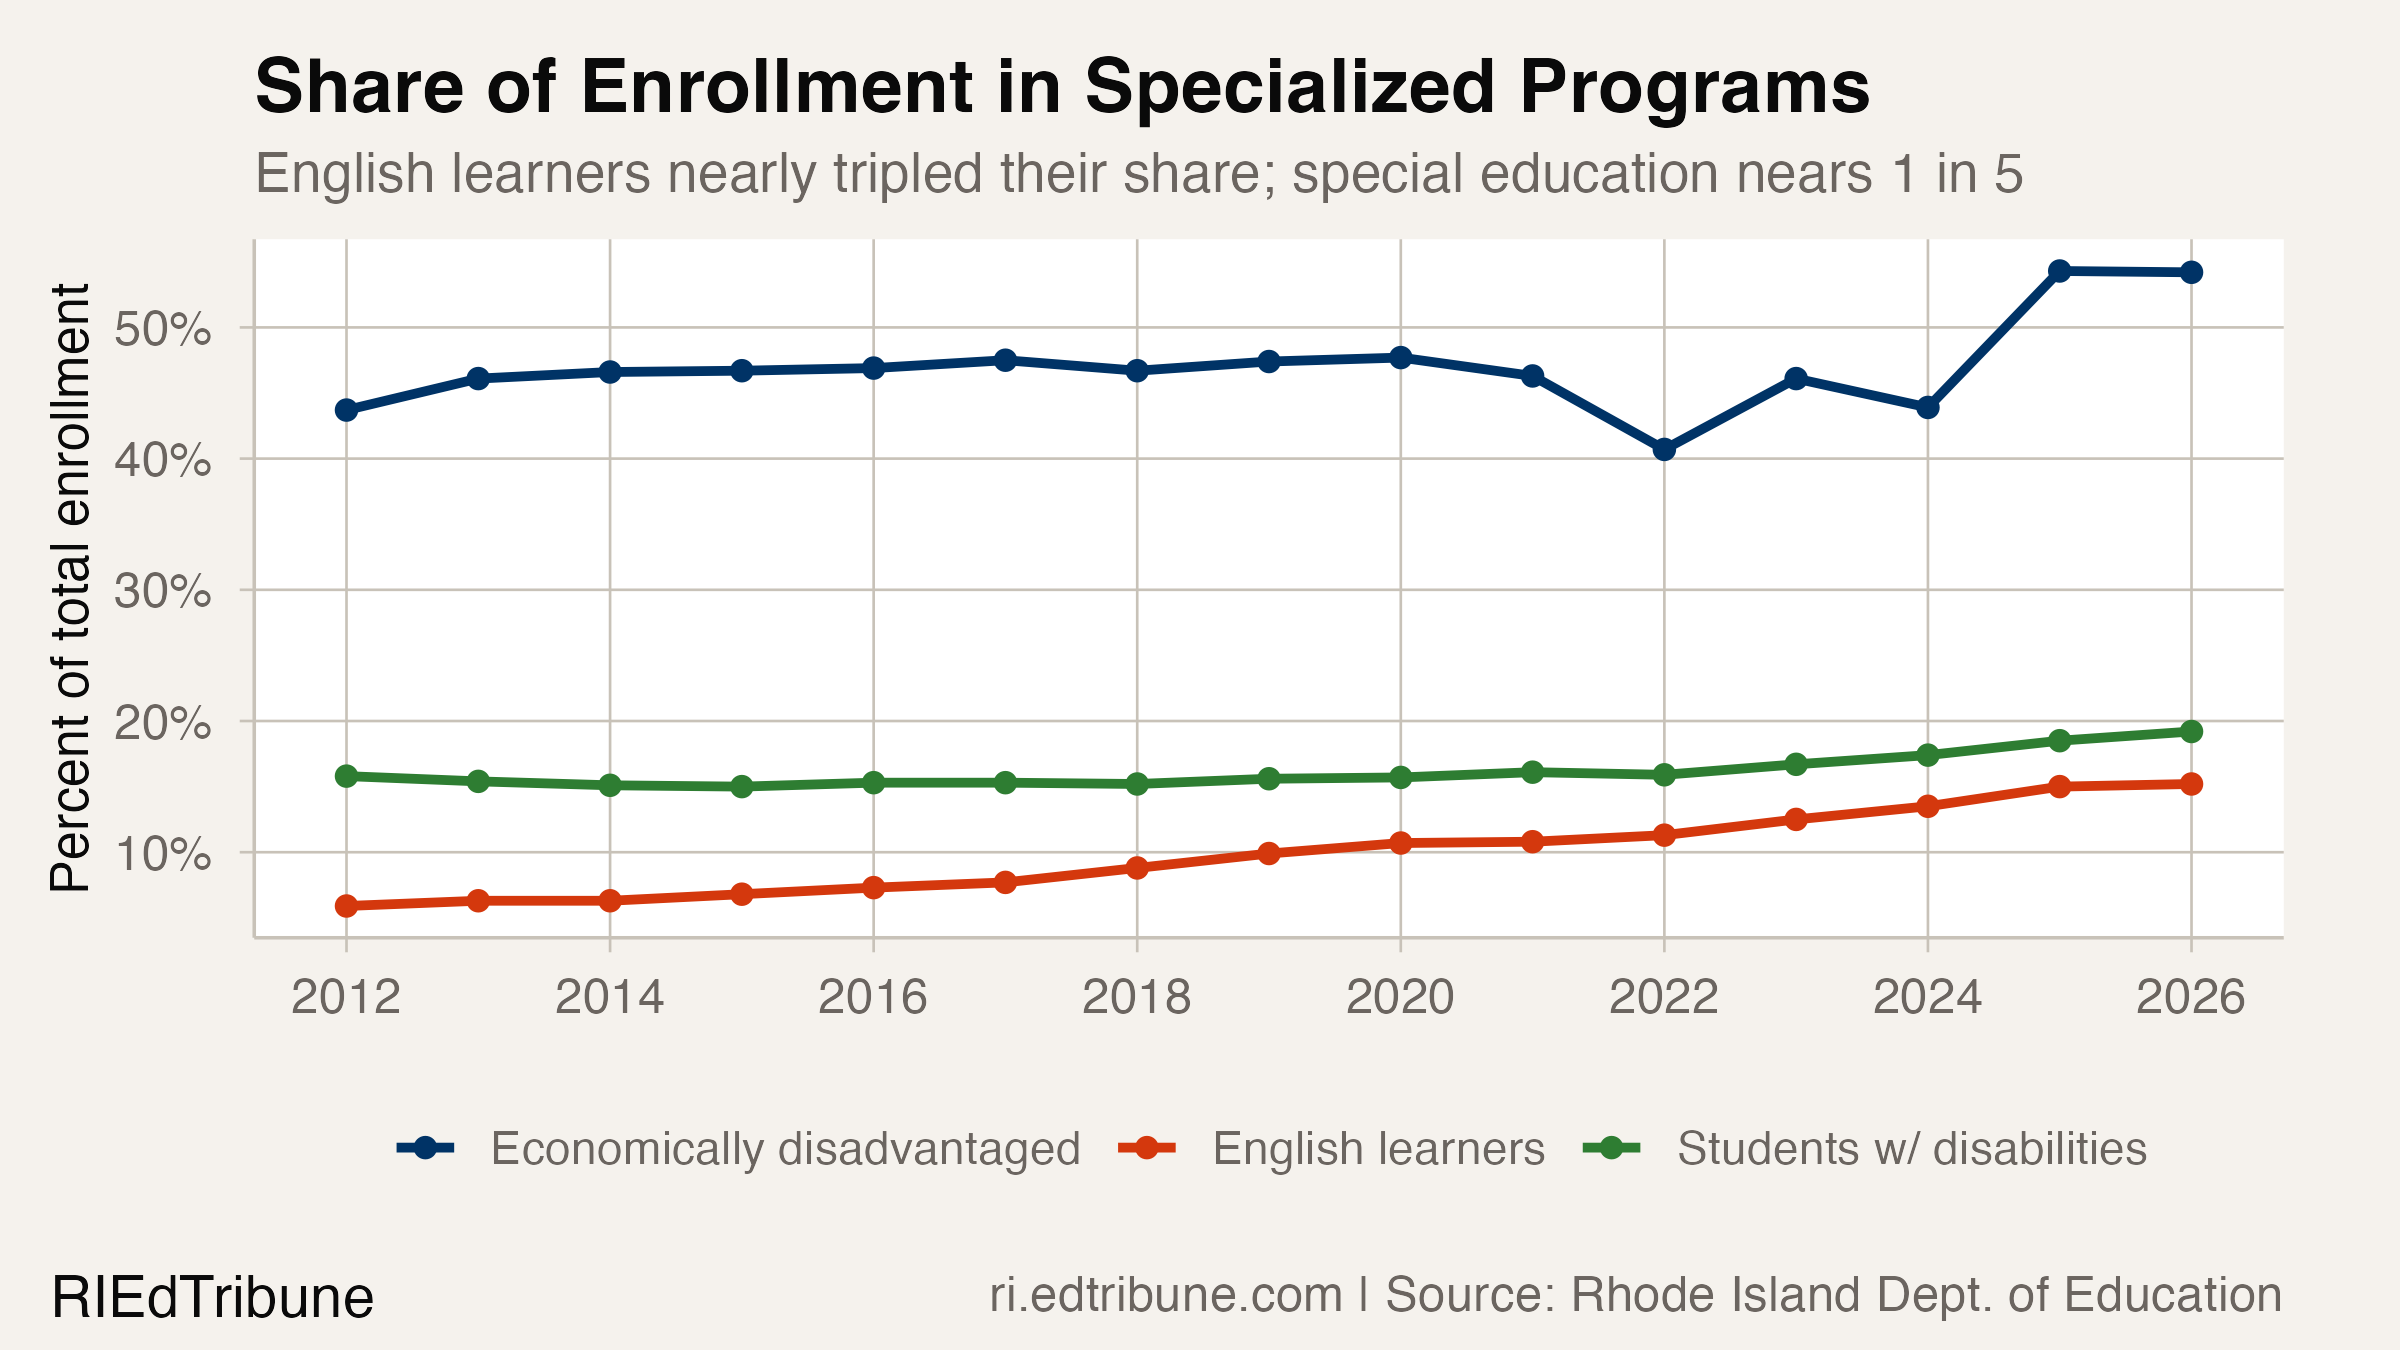
Special education enrollment also warrants scrutiny. At 25,755 students — 19.2% of enrollment, up from 15.8% in 2012 — nearly one in five Rhode Island students now receives special education services. RI KIDS COUNT data attributes part of the growth in autism-related services to improved screening and awareness. But whether the broader rise reflects more students who need services, more students being identified for services they always needed, or both, is not something enrollment data alone can answer.
Budget pressure
Forty-one of 64 districts lost students this year. The losses concentrate in the urban core: Providence lost 426, Pawtucket 282, Woonsocket 261.
| Largest losses | 2024-25 | 2025-26 | Change |
|---|---|---|---|
| Providence | 20,250 | 19,824 | -426 |
| Pawtucket | 7,816 | 7,534 | -282 |
| Woonsocket | 5,541 | 5,280 | -261 |
| Warwick | 7,853 | 7,704 | -149 |
| Westerly | 2,139 | 2,005 | -134 |
| Largest gains | 2024-25 | 2025-26 | Change |
|---|---|---|---|
| Excel Academy Rhode Island | 313 | 444 | +131 |
| MET Career and Tech | 817 | 894 | +77 |
| Segue Institute for Learning | 414 | 489 | +75 |
| Trinity Academy for the Performing Arts | 234 | 305 | +71 |
| RISE Prep Academies | 635 | 701 | +66 |
Rhode Island allocates state education aid partly on enrollment. Fewer students means less base funding, but buildings, bus routes, and administrative staff don't shrink proportionally. Districts losing 2-5% of enrollment in a single year face choices between cutting programs and running deficits.
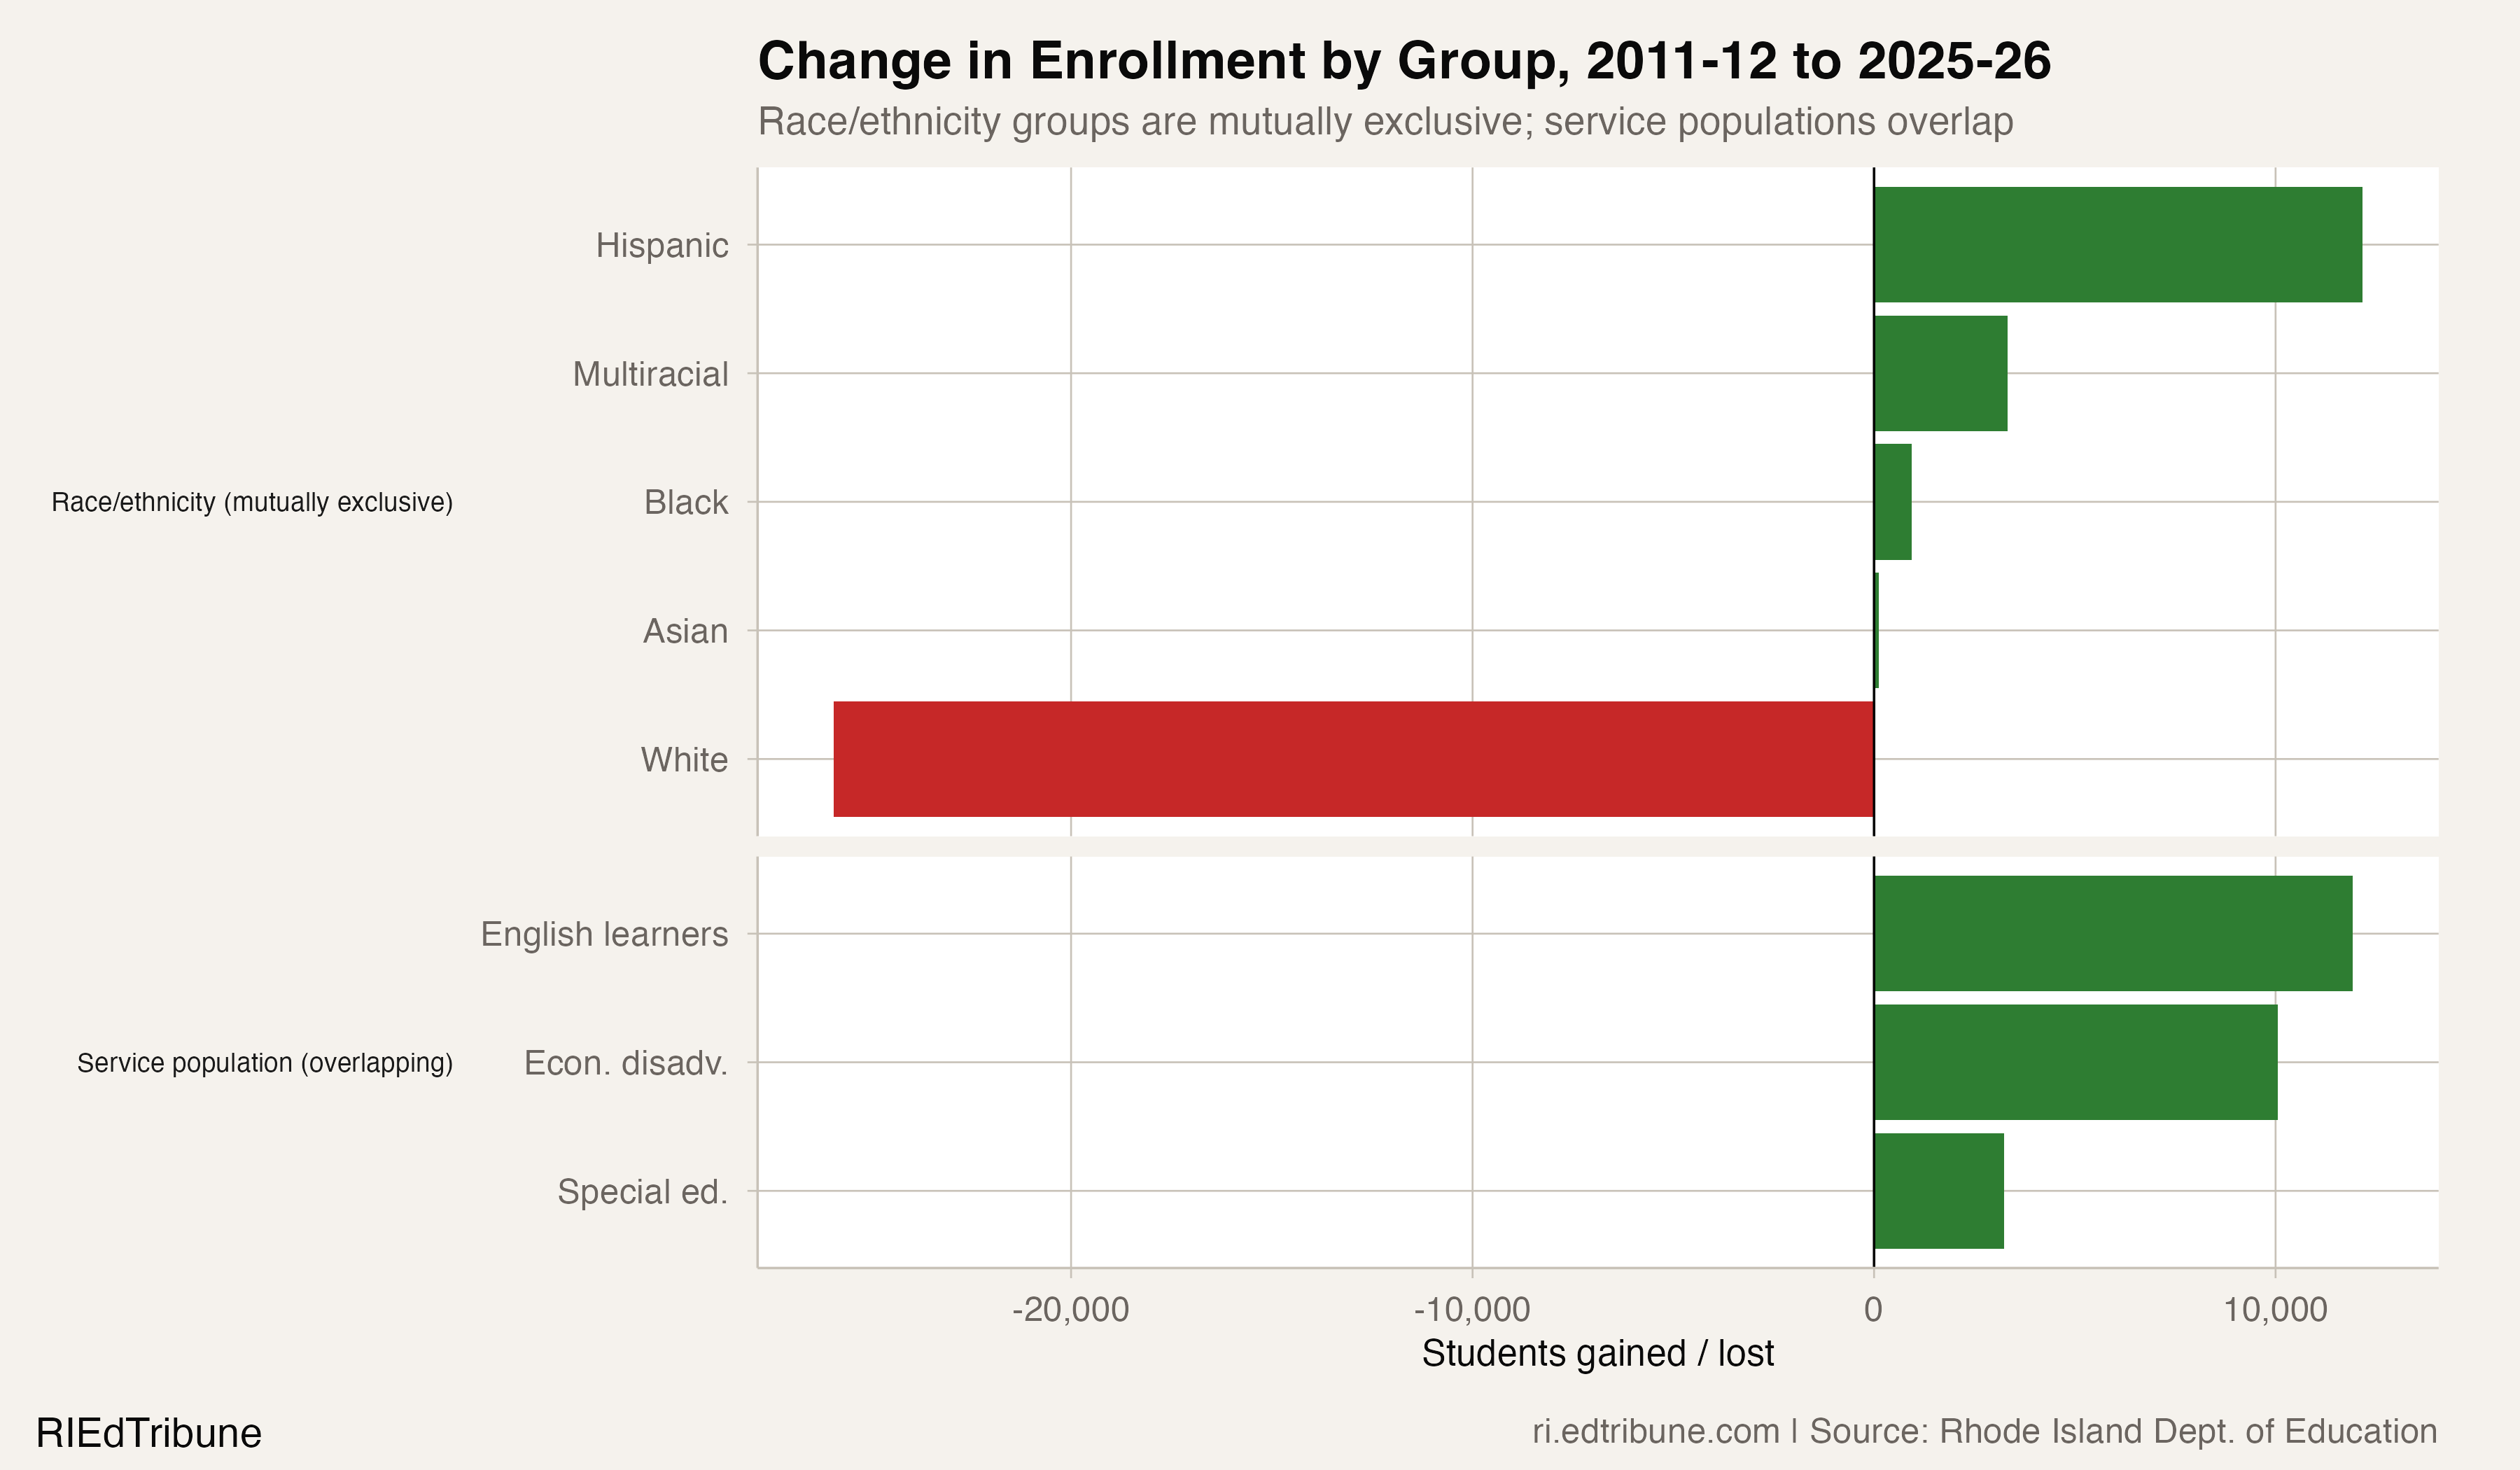
The growing share of students whose instructional programs carry higher per-pupil costs amplifies the structural mismatch. English learners now make up 15.2% of enrollment, students with disabilities 19.2%, and economically disadvantaged students 54.2% — these are overlapping categories, as many students fall into more than one, so the figures do not sum to a share of the student body. But each carries distinct program costs, and all three shares have grown while base enrollment declines, increasing demand for bilingual instruction, IEP services, and Title I programming.
The scale of these shifts becomes clearer in absolute terms. Race and ethnicity categories — where each student is counted once — show white enrollment driving nearly all of the net loss. Service-population categories like English learners and special education overlap with each other and with race, so their bars are not additive with the racial groups.
Data source
All enrollment figures are from the Rhode Island Department of Education, accessed via the rischooldata R package. The 2025-26 data uses the October 2025 enrollment file with full demographics at the district level. Full analysis and chart code: 2026-03-05-ri-enrollment-overview-analysis.R